All published articles of this journal are available on ScienceDirect.

Effects of Bileaflet Mechanical Mitral Valve Rotational Orientation on Left Ventricular Flow Conditions
Authors Info & Affiliations
Abstract
We studied left ventricular flow patterns for a range of rotational orientations of a bileaflet mechanical heart valve (MHV) implanted in the mitral position of an elastic model of a beating left ventricle (LV). The valve was rotated through 3 angular positions (0, 45, and 90 degrees) about the LV long axis. Ultrasound scans of the elastic LV were obtained in four apical 2-dimensional (2D) imaging projections, each with 45 degrees of separation. Particle imaging velocimetry was performed during the diastolic period to quantify the in-plane velocity field obtained by computer tracking of diluted microbubbles in the acquired ultrasound projections. The resulting velocity field, vorticity, and shear stresses were statistically significantly altered by angular positioning of the mechanical valve, although the results did not show any specific trend with the valve angular position and were highly dependent on the orientation of the imaging plane with respect to the valve. We conclude that bileaflet MHV orientation influences hemodynamics of LV filling. However, determination of ‘optimal’ valve orientation cannot be made without measurement techniques that account for the highly 3-dimensional (3D) intraventricular flow.
INTRODUCTION
The use of mechanical heart valves (MHVs) is widely accepted. However, the blood flow patterns following MHV implantation are altered compared to those in a healthy heart. In addition, MHV leads to increased levels of hemodynamic stress [1, 2], thus possibly undesirably stimulating thrombogenic conditions or resulting in platelet or red blood cell destruction.
Much work has been dedicated to the study of MHV hemodynamics through direct experimentation and simulation, both in vitro and in vivo, for a wide range of MHV designs [3]. In addition, many investigators studied long-term clinical outcome in patients following aortic or mitral valve replacement by a mechanical prosthesis or bioprosthesis, as summarized by Rahimtoola [4, 5]. These studies documented that, besides the hemodynamic and thrombogenic effects of the valve prostheses, comorbid conditions have key roles in clinical outcomes. However, these studies also revealed, but have not elucidated, a considerable variance in the survival rates in cohorts of patients with different mitral valve replacements.
In this context, far less attention has been given to quantifying the effects of rotational orientation of MHVs in the mitral position and the resulting interactions between the filling jet and cardiac structure. Most importantly for the purpose of our study, it appears that a mitral MHV can impair left ventricle (LV) diastolic filling if oriented arbitrarily [1, 6]. Considering that tilting-disc and bileaflet mitral MHVs generate highly directional flow patterns [7, 8], their implantation orientation has a direct effect on the resulting fluid-structure interactions. Given the directionality of MHV flow dynamics, multiple imaging planes are necessary before the resulting hemodynamics can be accurately quantified, which so far has been one of the limiting factors for further investigations.
We focused on systematic in vitro tests utilizing a mechanical left heart model and a frequently clinically used bileaflet MHV (St. Jude Medical, Inc., St. Paul, Minnesota) placed in the mitral position. The goal was to quantitatively characterize LV fluid dynamics by vorticity and turbulent shear stresses at defined echocardiographic (echo) imaging projections for predetermined MHV angular positions. Heart rate and stroke volume were kept constant.
MATERIALS AND METHODOLOGY
We utilized a mechanical left heart model (ViVitro Labs, Inc., Victoria, Canada) (Fig. 1A). The model was comprised of a tricuspid porcine aortic valve, an elastic LV, and a left atrium compartment separated from the LV by a removable atrioventricular module, in which a tested mitral valve could be placed in various angular positions. We used a St. Jude Medical bileaflet MHV with a 28 mm diameter. The studied angular positions of the mitral valve were 0, 45, and 90 degrees (Fig. 1B) with respect to a plane intersecting the center of the aortic valve, LV apex, and the mitral valve.
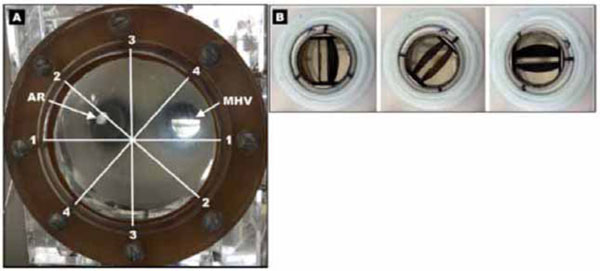
A) Photo of a mechanical left heart model showing a transparent elastic left ventricle viewed from the apex, the mechanical heart valve (MHV) and the aortic root (AR). Imaging planes are denoted by white lines and correspond to: 1 (90°), 2 (45°), 3 (0°), 4 (-45°). B) Placement of the bileaflet mechanical heart valve in the removable atrioventricular module in 0, 45, and 90 degree angular positions (viewed from the left atrium).
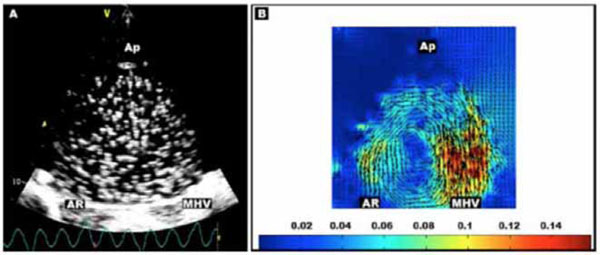
Representative scan (projection 3, valve angle 90 degrees) with A) Microbubbles, with mechanical heart valve (MHV), aortic root (AR), and LV apex (Ap) labeled. B) Echo PIV velocity vector field (m/s) obtained by microbubble tracking averaged over series of images.
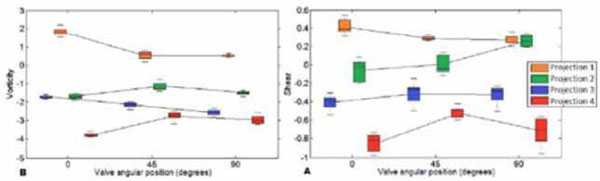
Box-and-whisker plots. Change in A) vorticity (1/s) and B) shear stress (Pa) with respect to the mitral valve angular position at each tested echo projection.
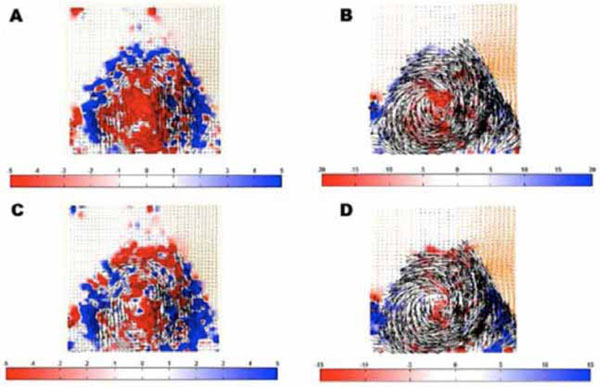
Vector flow fields temporally averaged over inflow period with A) Lowest vorticity magnitude (1/s; projection 1, valve at 90 degrees), B) Highest vorticity magnitude (1/s; projection 4, valve at 0 degrees), C) Lowest shear stress magnitude (Pa; projection 2, valve at 0 degrees) and D) Highest shear stress magnitude (Pa; projection 4, valve at 0 degrees). Note the different scales.
A pulsatile, sinusoidal flow was generated by an external pump that acted on the elastic LV from outside and produced two phases of controlled flow of saline through: 1) the aortic valve during “systolic” LV contraction (ejection phase) and 2) the mitral valve during “diastolic” LV expansion (filling phase). Other LV phases that are present in a native heart, for example, isovolumic contraction and relaxation, or early and late filling, were not modeled. All data were collected during the transmitral filling period determined from the motion waveform of the external pump, which was set to simulate 70 beats per minute and a stroke volume of 70 ml.
We employed a cardiac ultrasound system Vivid 7 (GE Vingmed Ultrasound AS, Horten, Norway) equipped with a 3D scanning transducer (3V, GE Healthcare), which supported 2D imaging with electronically rotated planes while the transducer itself was clamped in a fixed position. The rotational scans were projected through the existing ultrasound-transparent window in the mechanical model (Fig. 1A). The window location allowed approximating clinical apical long-axis projections, ie, interrogating the heart from the LV apex towards the mitral and aortic valves. The scans were acquired in 1) a conventional (grayscale) B-mode to obtain “anatomical” projections through the LV and 2) a contrast-enhanced mode for imaging of Optison (GE Healthcare) microbubbles (Fig. 2A) diluted 1:10 in saline. The ultrasound transmit power was set to 0 dB (ie, maximum “clinically-permissible” power) to obtain clear depiction of the microbubbles. It is noteworthy that in clinical settings, the transmit power (expressed as a mechanical index) is often reduced to minimize microbubble destruction during continuous scans because the overall dose that can be administered is limited. In our setting however, the diluted microbubbles were added to the circulating saline solution in repeated boluses of 0.1 ml as needed. Continuous echo scans were collected through many heart cycles to capture the microbubbles in optimal dilution and distribution to obtain high-quality scans for off-line microbubble tracking.
The tracking of the microbubbles (particles) was done using PIVlab freeware [9] programmed in Matlab (The MathWorks, Natick, Massachusetts) and resulted in echo particle imaging velocimetry (PIV). Echo PIV [10-12] was used to generate and quantify velocity vector fields (Fig. 2B) because of the ability to track particle motion without the need for visual access to the flow, which is typically necessary with optical PIV techniques that utilize a high-speed camera to visualize particle movement and a high-energy laser sheet to act as the flash. Echo PIV was performed off-line using the recorded echo DICOM images captured at 112 frames/s (ie, approximately 9 ms temporal resolution). Tracking through subsequent image frames included an adjustable multi-step pattern-matching search process resulting in generation of vector fields with an adequate range of detected velocities, such as in Fig. 2B. PIV analysis was performed using a standard fast Fourier transform cross-correlation algorithm and Gaussian 2×3 point sub-pixel estimator. Interrogation window size was reduced iteratively from 64×64 to 16×16 pixels (3.54 pixels/mm) with a 50% overlap.
The velocity vector fields served for generation of shear and vorticity fields, again by using off-line processing in Matlab. We reconstructed the velocity, shear, and vorticity fields in four clockwise (as viewed from the LV apex) 2D projections electronically rotated in 45-degree increments:
Projection 1 (90 degrees; resembling a clinical “4-chamber” echo view);
Projection 2 (45 degree; resembling a clinical “2-chamber” echo view);
Projection 3 (0 degree; resembling a clinical “3-chamber” echo view); and
Projection 4 (-45 degree, ie, orientation perpendicular to Projection 2).
Using echo PIV, a 2D velocity vector field (such as the one demonstrated in Fig. 2B) was generated for each of the 4 echo projections and for each of the three mitral MHV angular positions. Therefore, we obtained twelve 2D velocity vector fields characterizing flow inside the LV during the period of transmitral “diastolic” LV filling. Based on these velocity vector fields, we calculated the corresponding fluid vorticity and shear stress values.
Vorticity (ω) was calculated by taking the difference between the gradient of the y-component of velocity (ν) with respect to the x-direction and the gradient of the x-component of velocity with respect to the y-direction:
Vorticity reflects the rotational hemodynamic movement inside the biological LV. Due to energy dissipation from viscous interactions, a well-defined single vortex (ie, a relatively high magnitude of vorticity) leads to less kinetic energetic losses than chaotic (turbulent) flow with many small vortices [2]. Previous studies have demonstrated that formation of the LV diastolic vortex could serve as an indicator of cardiac health [13].
Shear stress (τ) is directly related to the time-rate-of-strain (velocity gradient) of a fluid:
Here, μ is the molecular viscosity coefficient of the fluid. Previous work [14] has established that high levels of shear stress will cause blood cell destruction or hemolysis in a biological heart [15].
The data were statistically analyzed for the LV filling period, during which the LV vortex is formed. PIV vector fields are temporally averaged over the LV filling cycle to minimize measurement noise. The numerical results of vorticity and shear stress are expressed as means and standard deviation based on data from seven consecutive, temporally averaged filling cycles. One-way ANOVA was used for parametric comparisons of measurements obtained 1) at incremental angular mitral valve position for a given projection and 2) at incremental angular echo projections for a given angular position of the mitral valve. Paired comparisons between angular mitral valve positions at a given echo projection were assessed using paired two-tailed T-tests. Box-and-whisker plots, which show the median (center mark), the 25th and 75th percentiles (box edges) and the most extreme data not considered outliers (whiskers), were used for quick visualization of data distribution at given mitral valve angular position and echo projection and to reveal trends, if any, in the data as mitral valve or echo projection is incremented.
RESULTS
The numerical results of vorticity and shear stress are summarized in Tables 1 and 2. In both tables, the negative values are a consequence of counterclockwise rotation of the flow in the original velocity vector fields.
Results for Vorticity (1/s).
| Projection # | Mitral Valve Angular Position | ANOVA P-value |
||
|---|---|---|---|---|
| 0 Degrees | 45 Degrees | 90 Degrees | ||
| 1 | 1.906 (0.198) | 0.646 (0.153)* | 0.478 (0.174)* | <0.001 |
| 2 | -1.631 (0.201) | -1.231 (0.133)* | -1.384 (0.186)*† | <0.001 |
| 3 | -1.703 (0.144) | -2.058 (0.193) * | -2.593 (0.211)*† | <0.001 |
| 4 | -3.678 (0.255) | -2.689 (0.196)* | -3.039 (0.223)*† | 0.002 |
| ANOVA, P-value | <0.001 | <0.001 | <0.001 | |
Results in parentheses represent standard deviation of the corresponding mean value.
* P<0.05 vs. 0 degrees
† P<0.05 vs. 45 degrees
Table 2. Results for Shear Stress (Pa).
| Projection # | Mitral Valve Angular Position | ANOVA P-value |
||
|---|---|---|---|---|
| 0 Degrees | 45 Degrees | 90 Degrees | ||
| 1 | 0.439 (0.12) | 0.307 (0.102)* | 0.254 (0.071)* | 0.010 |
| 2 | 0.001 (0.114) | -0.031 (0.083) | 0.317 (0.143)*† | <0.001 |
| 3 | -0.431 (0.108) | -0.301 (0.101)* | -0.302 (0.091)* | 0.040 |
| 4 | -0.907 (0.105) | -0.485 (0.097)* | -0.679 (0.113)*† | <0.001 |
| ANOVA, P-value | <0.001 | <0.001 | <0.001 | |
Results in parentheses represent standard deviation of the corresponding mean value.
* P<0.05 vs. 0 degrees
† P<0.05 vs. 45 degrees
In Table 1, the ANOVA p-values document a dependence of vorticity on both the echo projection and mitral valve position angles. Individual paired comparisons (marked by asterisks and crosses) indicate significant differences between mitral valve angular positions. However, a close observation of the individual measurements does not suggest any clear trend towards a systematic increase or decrease with mitral valve angular position.
In Table 2, a strong dependence of shear stress on both the echo projection angle and mitral valve angular position is again present (as in Table 1 for vorticity) without a clear trend towards a systematic increase or decrease with mitral valve angular position.
The results in both Tables 1 and 2 demonstrate that angular orientation of the mitral valve is a critical factor in producing flow shear and vorticity, without any clear trend with regard to an incremental change in the valve angular orientation. Furthermore, the ANOVA of values of vorticity and shear stress for any given mitral valve angular position clearly shows that the magnitudes of the two tested parameters are strongly influenced by the used projection.
Distribution of shear and vorticity values, as visually represented by box-and-whisker plots in Figs. (3A and 3B), respectively, confirm that both the mitral valve angular position and the used echo projections affect the results, and that there is no clear systematic trend in the values with respect to angular placement of the mitral valve.
Based on mean values in Tables 1 and 2, images in Fig. (4) are illustrative examples of 2D intraventricular flow vorticity and shear stress fields with the lowest and highest magnitudes. While high vorticity and low shear stress magnitudes of intraventricular flow would be beneficial, the results obtained in our model did not reveal any clearly “optimal” mitral valve angular position that would combine the two desirable conditions.
DISCUSSION
The main finding of our experimental study, which utilized an elastic mechanical model of a beating LV and a bileaflet MHV in the mitral position, is that the rotational position of the valve is a critical determinant of the LV flow characteristics. This finding is important in the context of other studies that implied the importance of the prosthetic valve rotational orientation on the downstream turbulence and risk of microembolization using both in vivo experimentation and computational methods [16-18], as well as animal studies [19]. So far, existing research has focused on anatomical and “anti-anatomical” angular orientation of MHVs using fixed 2D ultrasound and MRI imaging planes [2, 19, 20]. Our study extends these results by showing the significant effect of 45-degree incremental angular positioning of the mitral valve on intraventricular flow patterns, vorticity, and shear stresses.
Furthermore, we show that selection of a 2D projection for visualization of velocity vector patterns or quantitation of vorticity and shear stresses, which are indeed complex 3D intraventricular flow phenomena, is another critical factor. In certain studies investigating LV hemodynamics influenced by MHV orientation, only a single imaging plane has been utilized and calculations were based on optical-PIV, echo-PIV, or MRI data obtained within that plane [2, 16]. Our study implies that to fully quantify mitral MHV performance based on rotational orientation, it is necessary to obtain data from all standard echo imaging planes. Clearly, using just one projection could be significantly misleading in assessing hemodynamic impact, such as the magnitude of vorticity and shear stress. Therefore, it may be necessary to not only use the standard echo projections but, in fact, come up with additional “non-standard” echo projections optimized for evaluation of hemodynamic patterns and parameters.
Noticeably, projections 2 and 4 (i.e., perpendicular projections at 45 and -45 degrees, respectively) did not produce shear and vorticity values with the same magnitude. We speculate that there was some asymmetricity in the LV shape, transvalvular flow, off-axis aiming of the ultrasound transducer, or combination thereof, which would be the case also in a clinical setting. Ideally, the evaluation should be performed in a fully 3D echo imaging mode. Although the current real-time 3D ultrasound imaging systems have recently made tremendous technological advances, they still do not provide sufficient temporal resolution for analyses of transmitral and intraventricular fluid dynamics.
Our results do not clearly convey an “optimal” bileaflet mitral MHV angular position, which would be characterized by a well-developed diastolic rotating fluid mass (ie, high magnitude of vorticity) with low shear stresses. Although, close assessment of the magnitudes in Tables 1 and 2 and, especially, visual inspection of some trends in Fig. (3) suggest that an angular position of the mitral valve between 0 and 45 degrees approaches to some extent the desirable combination of high vorticity with low shear stresses. In this context, it is of note that the two tested parameters, ie, vorticity and shear stress, although they have a different physical meaning, have been derived from the same source data (ie, velocity vector fields) and thus, may not be entirely independent. Simulation of cardiac performance at various heart rates, stroke volumes, and pressure loading would have likely shed more light on the mitral angular position for optimal fluid dynamic performance.
The limitations of our study are that the measurements were influenced by the lack of the right ventricular cavities and pulmonary circulation. Also, the simplified “anatomy” of the elastic LV is lacking, for example, native cardiac wall, papillary muscles, trabecules, or considerable natural asymmetric shapes of the LV and its outflow tract. Implantation of the MHV into native (porcine or dog) beating hearts ex vivo or in vivo at different angular positions of the mitral would alleviate the aforementioned limitations, although at a cost of reduced or no control to achieve perfectly constant hemodynamic conditions during measurements, as we could during the current study. Another limitation is that the results were not obtained during systematically changed loading conditions. In our present model, these interventions were not entirely separable and, therefore, we elected to conduct this initial study under a well-defined single steady-state condition.
Clinically, replacement of a severely damaged and hemodynamically detrimental native mitral valve by a mechanical prosthesis is an important therapeutic solution. However, suboptimal “arbitrary” angular positioning of the mitral prosthesis may have an undesired effect on intraventricular hemodynamics. In particular, impaired generation of a vortex ring is not clinically reported and, yet, it is now recognized as a contributing mechanism of diastolic dysfunction in patients with hypertrophic cardiomyopathy [21]. Consequently, impairment of the natural diastolic vortex by the suboptimal positioning of the MHV could result in kinetic energetic losses or have thrombogenic effects, and may therefore undesirably affect the long-term clinical outcome.
CONCLUSION
Our initial study strongly suggests that angular positioning of the MHV is an important determinant of intracardiac hemodynamic conditions. More studies need to be done ultimately leading to optimization of mitral valve angular placement and, thus, contributing to long-term patient life quality and survival.
CONFLICT OF INTEREST
The authors confirm that this article content has no conflict of interest.
ACKNOWLEDGEMENTS
This study was funded by the ASU/Mayo Seed Grant provided to support collaboration between investigators from the Arizona State University and Mayo Clinic Arizona.