All published articles of this journal are available on ScienceDirect.

The Value of p-Value in Biomedical Research
Abstract
Significance tests and the corresponding p-values play a crucial role in decision making. In this commentary the meaning, interpretation and misinterpretation of p-values is presented. Alternatives for evaluating the reported evidence are also discussed.
INTRODUCTION
Evidence-based medicine aims to apply scientific information retrieved from the research to certain parts of medical practice. Particularly, it seeks to assess the quality of evidence relevant to the risks and benefits of individuals’ characteristics or treatments [1]. According to the Centre for Evidence-Based Medicine, "Evidence-based medicine is the conscientious, explicit and judicious use of current best evidence in making decisions about the care of individual patients" [2]. A cornerstone in evidence-based medicine is decision quality. Under the concept of evidence-based medicine the research is categorized and ranked according to the strength of the lack from various biases. The strongest evidence for therapeutic interventions is provided by meta-analyses of randomized, double-blind, controlled clinical trials. On the contrary, case reports and expert opinion have little value. The U.S. Preventive Services Task Force [1] ranks scientific evidence in the following order: (a) Evidence obtained from more than one randomized controlled trials (Level I); (b) Evidence obtained from controlled trials without randomization (Level II-1); or Evidence obtained from prospective or case-control epidemiologic studies (Level II-2); or Evidence obtained from multiple time series with or without the intervention (Level II-3); and (c) Opinions of respected authorities, based on clinical experience, descriptive studies, or reports of expert committees (Level III). The UK National Health Service uses a similar system with categories labeled A, B, C, and D. Anytime a selection must be made among several alternative choices, a decision is being made, and the role of the researcher is to assist in this process. Especially, when decisions are complicated and require careful consideration and systematic review of the available information, the researcher’s role becomes paramount.
Evidence-based medicine attempts to express clinical research using mathematical methods. Tools used by researchers include: the likelihood ratios, various (univariate or multivariate) statistical tests, the area under the receiver operator characteristic curve (ROC) and many others. The p-value is one of the most widely used statistical terms in decision making in biomedical research, which assists the investigators to conclude about the significance of a research consideration. Up today, most researchers base their decision on the value of the probability p. However, the term p-value is often miss- or over- interpreted, leading to serious methodological errors and misinterpretations [3]. In this article the interpretation of the p-value and some alternatives options are discussed.
DEFINITION OF THE P-VALUE
In statistical science, the p-value is the probability of obtaining a result at least as extreme as the one that was actually observed in the biological or clinical experiment or epidemiological study, given that the null hypothesis is true [4]. The testing of hypothesis is fundamental in statistics, and it could be considered as a “method” of making statistical decisions using experimental data. At this point we have to introduce some terms regarding hypothesis testing. There are two hypotheses, the null and the alternative. Usually, the null hypothesis that indicates no association between the investigated factors or characteristics (measured using random variables), e.g., “the prevalence of cardiovascular disease is equal between males and females”; thus, “there is no association between gender and the disease”. On the other hand, the alternative hypothesis indicates an association between the investigated variables (i.e. the prevalence of cardiovascular disease differs between genders (two-sided hypothesis), or the prevalence of males is greater than the prevalence of females or the prevalence of females is greater than the prevalence of males (one-sided hypothesis). In the 1950s, Fisher [5] proposed significance tests as a means of examining the discrepancy between the data and the null hypothesis. Some of the most often used significance tests in biomedical research are: the Z-test, the Student’s t-test, the F-test and the chi-square among others.
In statistical theory, the p-value is a random variable defined over the sample space (i.e. the set of all possible outcomes) of the experiment, such that its distribution under the null hypothesis is uniform on the interval (0, 1). For example, a phase III clinical trial (experiment) is performed to determine if total cholesterol levels differ between the group that was under drug A treatment, compared with the group that was under drug B treatment. For simplicity, it is assumed that baseline levels of cholesterol were equal, and after 12 months of treatment a mean absolute reduction on total cholesterol levels of 27±10 mg/dl was observed in group A and a mean absolute reduction of 25±10 mg/dl was observed in group B. If 100 patients were allocated to each treatment arm, and taking into account the assumptions of the appropriate significance test, the p-value of this hypothesis testing is equal to 0.15. In this case the null hypothesis is that “in the population the mean absolute reductions were equal” against the alternative were “in the population the mean absolute reductions were not equal”. The p-value of this result is the chance of observing a 2 mg/dl difference between the two treatment arms, under the context that a similar reduction on cholesterol levels exists (i.e., the null hypothesis). The p-value of 0.15, means that the observed difference can be attributed to chance by 15%. In Fisher’s approach the null hypothesis is never proved, but is possibly disproved. Moreover, Fisher suggested 0.05 as a threshold of significance (i.e., α); if the p-value is less than α, there is evidence to reject the null hypothesis. However, there has been considerable criticism about this choice, and its usefulness. Despite the criticisms made, all agree that the significance level should be decided before the data are viewed, and is compared against the p-value after the test has been performed. Moreover, although p-values are widely used, there are several misunderstandings. In the text below, an attempt is made to clarify what the p-value really is and what it is not.
WHAT THE P-VALUE IS AND WHAT IT IS NOT.
The p-value is not the probability that the null hypothesis is true, and this is because hypotheses do not have probabilities in classical statistics. Moreover, the p-value is not the probability of falsely rejecting the null hypothesis. Falsely rejecting the mull hypothesis is a Type I error. This error is a version of the so-called “prosecutor's fallacy”. The Type I error rate is closely related to the p-value since we reject the null hypothesis when p-value is less than a pre-defined level, α. The p-value does not indicate the size or importance of the observed effect. Thus, a very small p-value, let say 0.000… (usually presented as <0.001) does not necessarily mean a strong association (compared with effect size which is a measure of the strength of the relationship between 2 variables, e.g. odds ratio, relative risk, correlation coefficient, Cohen’s d etc [5, 6]). Moreover, the p-value is influenced by sample size. For example, the Fig. (1) illustrates the impressive decrease in p-value according to sample size, keeping the observed findings constant. It can be seen that if the initial sample size is doubled (i.e. n=200 per treatment arm) the study’s results achieve significance.
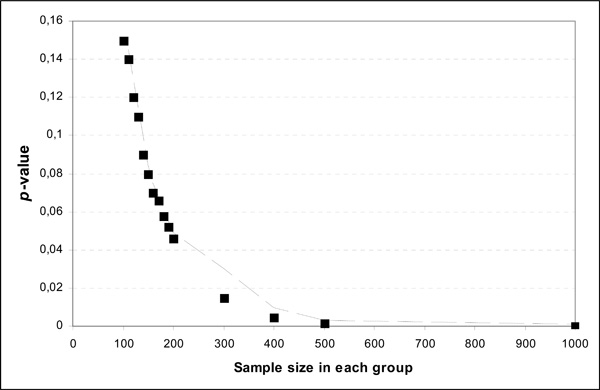
Theoretical example of p-values in relation to sample size for the same difference in the data.
Another major issue that influences medical decision making is the multiple comparisons problem which occurs when a family of statistical inferences is considered simultaneously. For example, with just one hypothesis test performed at 5% significance level, there is only a 5% probability of obtaining a result at least as extreme as the one that was observed when the null hypothesis is true. However, with 100 tests performed with all null hypotheses being true, it is more likely that at least one null hypothesis will be rejected. These errors are called false positives, and many mathematical techniques have been developed to control them. Most of these techniques modify the significance level α, in order to account for the inflation of type I error rate and make the comparison of p-value more accurate.
For all the aforementioned reasons, many Journals have long been recommended to the authors to present confidence intervals instead of p-values since they are not considered mathematically sound [7].
Finally, the p-value is not the probability that the experiment would not yield the same conclusion after replications. For this reason Killeen [8] proposed prep as a statistical alternative to the p-value, which calculates the probability of replicating an effect. An approximate of the prep is the following:
The lower the p-value is, the higher the prep. The Association for Psychological Science (APS) recommends to contributing authors of journals to present prep instead of p-values. However, considerable criticism has been made. For example, prep does not take prior probabilities into account [9], and does not bring any additional information on the significance of the result of a given experiment.
Recently, Ioanndis [10] suggested that more “detailed” statistical methods should be applied, like Bayes factor B, to interpret ‘‘significant’’ associations. In general, Bayesian inference is a method for determining how scientific belief should be modified by observed data. Most important, Bayes factors require the addition of background knowledge to be transformed into inferences. The simplest form of Bayes factor is the likelihood ratio (i.e., the ratio Λ of the maximum probability of a result under two different hypotheses, the null where no associations are observed and the alternative). The minimum Bayes factor is objective and can be used instead of p-value as a measure of the evidential strength. However, medical researchers have not been so enthusiastic to understand and adopt that Bayesian statistical methodologies perceive a subjective approach to evidence-based analysis. Despite the criticism, for many scientists the use of Bays factor B is an alternative to the classical hypothesis testing mentioned above. Particularly, as Ioannides observed, when the factor B was calculated on 272 observational studies and 50 meta-analyses on gene-disease associations (752 studies) for which statistically significant associations had been claimed (p<0.05), statistically significant results offered less than strong support to the credibility for 54–77% of the epidemiologic associations and 44–70% of the 50 associations from genetic meta-analyses [10].
In brief, unlike p-values, Bayes factors have a sound interpretation that allows their use in both inference and decision making, since they make the distinction clear between experimental evidence and inferential conclusions while providing a framework in which to combine prior with current evidence.
CONCLUDING REMARKS
In this article an attempt was made to interpret the meaning of p-value, a probability that is the basis, in most biomedical research, of decision making. Recent guidelines for presenting the results of clinical experiments or observational studies, suggest providing confidence intervals instead or together with the p-values, and giving the effect sizes of the investigated associations. Nevertheless, the p-value still has significant value when correctly interpreted and used.