All published articles of this journal are available on ScienceDirect.

Correlations Between Cardiovascular Autonomic Control Indices During the Two-hour Immobilization Test in Healthy Subjects
Authors Info & Affiliations
Abstract
Objective:
The aim of the present study was to assess the features of dynamics of cardiovascular autonomic indices and correlations between them during the two-hour immobilization test in healthy subjects.
Methods:
Photoplethysmogram (PPG) and electrocardiogram were recorded simultaneously during the two-hour immobilization test in 14 healthy subjects (5 men and 9 women) aged 29±5 years (mean±SD). Dynamics of heart rate variability (HRV) power spectrum in high-frequency and low-frequency ranges (in ms2 and percents of total spectral power), mean heart rate (HR), and index S of synchronization between 0.1-Hz rhythms in PPG and HR were analyzed.
Results:
Individual dynamics of all studied cardiovascular autonomic indices during the two-hour immobilization test was unique in each healthy subject. Two groups of healthy subjects were identified basing on individual features of autonomic control. The group with initial low level of index S maintained the low level of S during the two-hour immobilization test. The group with initial high index S maintained the high level of S only during the first 100 minutes of test. During the last 20 minutes of test, index S was similar in both groups. Many cardiovascular autonomic indices correlate between themselves for an individual subject, but they do not correlate between the subjects. Multiple regression analysis in each subject has shown a high correlation between mean HR and all other studied autonomic parameters in 57% of subjects (multiple R>0.9, P<0.05). For 204 records analyzed without taking into account the individual features of subjects, the above mentioned correlation was smaller (multiple R=0.45, P<0.001). Index S was found out to be the most independent one among the autonomic indices.
Conclusion:
Cardiovascular autonomic control is characterized by a pronounced variability among healthy subjects and stability in time in each subject. We have not found any regularity in variation of cardiovascular autonomic indices, which is common for the entire group of healthy subjects during the two-hour immobilization test. Mean HR is a summary index of efficiency of heart autonomic control. Index S is the most independent cardiovascular autonomic parameter.
INTRODUCTION
Autonomic control of cardiovascular system (CVS) is the main criterion of health status assessment. It is known that autonomic dysfunction is an important predictor of cardiovascular risk [1, 2]. The classical method of assessment of cardiovascular autonomic control is the analysis of heart rate variability (HRV). Various indices are used for this purpose [1] and their physiological explanation is well known [1, 3-5]. Sometimes, the interpretation of these indices may be difficult due to methodological reasons [6]. HRV indices can assess cardiac autonomic regulation, but not peripheral blood flow.
Investigation of low-frequency rhythms of CVS attracts a lot of attention of researchers in recent time [7, 8]. These rhythms having a frequency of about 0.1-Hz are observed in different signals of CVS, for example, in heart rate (HR) and photoplethysmogram (PPG). The results of our previous studies have shown that 0.1-Hz oscillations in HR and PPG are synchronized between themselves the most of time in healthy subjects [9, 10]. From physiological viewpoint, the synchronization of 0.1-Hz oscillations is the result of adequate functional interaction of CVS parts (heart and peripheral vessels) provided by cardiovascular autonomic control. The quality of synchronization between 0.1-Hz oscillations in HR and PPG is the main parameter for cardiovascular risk assessment [2] and control of drug therapy in patients with some cardiovascular diseases [11, 12].
According to many researchers, 0.1-Hz oscillations in HR are associated with baroreflex regulation of blood pressure (BP) [5, 7]. But the origin of 0.1-Hz oscillations in PPG is more debatable. It was shown PPG contains information about both microcirculatory bed and blood filling of digital arteries. Therefore, 0.1-Hz oscillations in PPG may be also associated with baroreflex regulation. But some authors dispute this point of view [13-17]. In the present paper, we do not interpret the origin of 0.1-Hz oscillations in PPG, but study their involvement in cardiovascular synchronization. In recent time, many authors propose various PPG parameters to evaluate short-term cardiovascular regulation [18].
Correlations between indices of cardiovascular autonomic control were in focus of some previous studies [19-21]. The statistically significant correlations between the most of HRV indices were observed.
The aim of the present study is to assess the features of dynamics of cardiovascular autonomic indices and correlations between them during the two-hour immobilization test in healthy subjects.
MATERIAL AND METHODS
Patients
The study was approved by the Ethics Committee of the Saratov Research Institute of Cardiology in Saratov, Russia, and informed consent was obtained from all participants.
Our study included 14 healthy subjects (5 men and 9 women) aged 29±5 years (mean±SD). Healthy status of all subjects was confirmed by the results of clinical investigation in the clinic of Saratov Research Institute of Cardiology (Saratov, Russia).
Signal Recording
To examine the autonomic control of CVS we carried out HRV analysis and estimated a degree of synchronization between the 0.1-Hz rhythms in HR and PPG. PPG, measured on the middle finger of the subject’s hand, electrocardiogram (ECG), and respiration were simultaneously recorded during a two-hour immobilization test. During the test a subject was fixed in a supine position under spontaneous breathing in a quiet dark room. The subject was not sleeping.
The signals were recorded with the sampling frequency 250 Hz and 14-bit resolution. The record of respiration was used to control evenness of breathing. We excluded from the analysis the series with forced inspiration and delays in breathing. For further analysis only ECG and PPG records without artifacts, extrasystoles, and considerable trends were left.
Signal Processing
For signal processing, each of two-hour simultaneous records of PPG and ECG was divided into 12 fragments with duration of 10 minutes. In each 10 minute fragment, we analyzed HRV in the frequency domain. High-frequency (HF) range (0.15-0.4 Hz) and low-frequency (LF) range (0.04-0.15 Hz) of HRV power spectrum and mean HR were analyzed [1]. Power of LF and HF bands in HRV power spectrum was presented in absolute values (ms2), named as LF and HF, and in percents of total spectral power named as LF% and HF%. LF/HF ratio was also calculated [1]. Very low-frequency range of HRV was not included in our analysis to avoid questionable results, because we analyzed short-time ECG records [1].
To estimate synchronization between the 0.1-Hz rhythms in HR and PPG we used the method proposed by us recently [10]. Index S defines the relative time of synchronization between the considered 0.1-Hz rhythms.
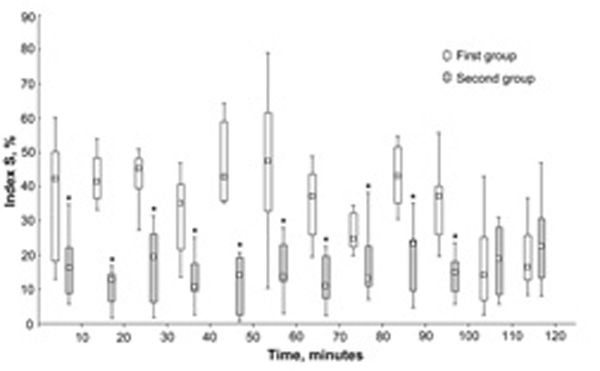
Index S dynamics during the two-hour immobilization test in two groups of subjects. Data presented as box plot graphs (min, Q1, Me, Q3, max). * significantly different from the first group.
Statistical Analysis
Continuous variables are reported as medians with inter-quartile ranges, Me (Q1, Q3). Categorical data are presented as frequencies and percentages. The obtained estimations were considered statistically significant if P<0.05. For a statistical analysis the software package Statistica 6.0 (StatSoft Inc., Tulsa, Oklahoma, USA) was used.
We apply the Shapiro-Wilk test to check whether the data are approximately normally distributed. Since some data occur to be non-normal, their further analysis was carried out using non-parametric statistical methods. To compare the variables between patients’ groups we used the Mann-Whitney test. To compare the variables within one patients’ group we used the Wilcoxon test. Paired relationships between continuous variables were assessed using Spearman correlation coefficients R. The cases R([0.68-1.0], R([0.36-0.67], and R≤0.35 correspond to high correlation, moderate correlation, and low correlation, respectively [22].
To separate the studied subjects into groups in accordance with the values of their autonomic indices we used a cluster analysis. Multiple regression analysis was used for studying the relationship between several predictor variables and a dependent variable.
RESULTS
Dynamics of Parameters of Autonomic Regulation During the two-hour Immobilization Test in Healthy Subjects
In the first 10 minutes of the two-hour immobilization test, we obtained the following levels of analyzed autonomic parameters:
mean HR was 68 (59, 72) beats/min,
Index S of synchronization between the 0.1-Hz rhythms in HR and PPG was 22.2 (15.9, 41.6) %,
LF was 402 (209, 648) ms2,
HF was 481 (166, 715) ms2,
LF% was 22.6 (14.2, 30.2) %,
HF% was 23.7 (9.7, 35.8) %,
LF/HF was 1.2 (0.8, 1.6).
As a result of cluster analysis, two groups of subjects were identified basing on individual dynamics of index S and power of HRV spectrum in LF and HF ranges during the test. The first group consisting of 9 subjects (3 men and 6 women) has significantly higher values of index S during the first 100 minutes of test than the second group consisting of 8 subjects (3 men and 5 women) (Fig. 1). During the last 20 minutes of test, the values of index S were similar in both groups. Also these groups have no any significant differences in mean HR, LF, LF%, HF, HF%, and LF/HF.
Individual dynamics of all studied cardiovascular autonomic indices during the two-hour immobilization test was unique in each healthy subject. We have not found general regularities in variation of indices during the test within the entire group of subjects.
Correlations between the HRV parameters and index S.
| Mean HR | Index S | LF | LF% | HF | HF% | |
|---|---|---|---|---|---|---|
| Index S | R=0.31, P<0.001 | |||||
| LF | R<0.01, P=0.988 | R=-0.14, P=0.071 | ||||
| LF% | R=0.09, P=0.253 | R=0.06, P=0.379 | R=0.63, P<0.001 | |||
| HF | R=0.06, P=0.491 | R=-0.23, P=0.002 | R=0.69, P<0.001 | R=0.26, P=0.001 | ||
| HF% | R=0.17, P=0.024 | R=-0.15, P=0.055 | R=0.29, P<0.001 | R=0.20, P=0.011 | R=0.83, P<0.001 | |
| LF/HF | R=-0.15, P=0.057 | R=0.11, P=0.163 | R=-0.01, P=0.849 | R=0.23, P=0.003 | R=-0.69, P<0.001 | R=-0.87, P<0.001 |
Hypothesis No.1: Correlations between Parameters of Autonomic Regulation have Common Features in Healthy Subjects
To check this hypothesis the autonomic parameters (mean HR, LF, HF, LF%, HF%, and LF/HF) assigned from all 10 minute records (204 records extracted from 17 two-hour records in 17 subjects) were analyzed together, i.e. without separation of subjects and duration of immobilization. In these 204 records, we analyzed correlations between the studied HRV parameters and index S using Spearman correlation analysis (Table 1).
Percents of subjects with moderate or high correlation between the HRV parameters and index S during the two-hour immobilization test.
| Mean HR | Index S | LF | LF% | HF | HF% | |
|---|---|---|---|---|---|---|
| Index S | 36 (7) | |||||
| LF | 79 (36) | 50 (7) | ||||
| LF% | 43 (14) | 43 (0) | 64 (36) | |||
| HF | 64 (36) | 50 (0) | 79 (43) | 43 (7) | ||
| HF% | 29 (14) | 43 (0) | 29 (7) | 71 (21) | 50 (21) | |
| LF/HF | 50 (21) | 43 (0) | 57 (43) | 64 (36) | 57 (14) | 79 (29) |
Data presented as A (A1), where A is a total percent of subjects with moderate or high correlation (Spearman R ≥0.36) and A1 is a percent of subjects with high correlation (Spearman R ≥0.68).
High correlation was observed between the LF and HF indices (Table 1). Correlations between the LF and HF indices presented in absolute values and percents were significant. However, LF% and HF% were independent from total power of HRV spectrum, in contrast to LF and HF. Mean HR showed statistically significant low correlation with index S and HF%. Index S had statistically significant low correlation only with HF (Table 1).
Multiple regression analysis based on all 204 records has shown moderate correlation of mean HR with all other autonomic parameters (multiple R =0.45, Adjusted R2 =0.17, F(6.161)=6.66, P<0.001).
Hypothesis No.2: Correlations Between Parameters of Autonomic Regulation have Individual Features in each Healthy Subject
To check this hypothesis we studied correlation between the HRV parameters and index S during the two-hour immobilization test in each healthy subject separately. The obtained results are presented in Table 2 as percents of subjects with moderate or high correlation (R ≥0.36, P<0.05) between the studied parameters during the two-hour immobilization test.
Mean HR was correlated with LF and HF in most of subjects (79% and 64%, respectively) and with LF/HF in half of subjects. Note, in some healthy subjects, mean HR was highly correlated with all or most of studied autonomic parameters (Table 2). Index S was correlated moderately with studied HRV parameters almost in half of the subjects.
The correlations between LF and HF, LF and LF%, and HF and HF% were similar to those described in the previous subsection (compare Tables 1 and 2). However, the correlation between LF% and HF% was higher during immobilization test in each healthy subject (Table 2). It should be noted that the sign of correlation was different in patients (Fig. 2).
Multiple regression analysis carried out for each subject has shown high correlation between the mean HR and all other studied autonomic parameters in 8 (57%) subjects (multiple R >0.9, P<0.05).
DISCUSSION
According to our results, the healthy subjects with initial low level of synchronization between the 0.1-Hz oscillations in HR and PPG maintain this low level during all 120 minutes of the immobilization test. The subjects with initial high level of synchronization maintain this high level during the first 100 minutes of the test. After that a decrease of index S to lower values is observed. Index S can be considered as an integrated criterion for assessment of systemic autonomic control, which is estimated by analyzing the cardiovascular synchronization. Individual features of cardiovascular synchronization shown in the present study suggest a substantial variation of autonomic control among healthy subjects and its stability in time in each subject.
In the present study, we mainly used frequency domain measures of HRV, such as LF, LF%, HF, HF% and LF/HF. Some other papers have shown statistically significant correlation between the most of time and frequency domain variables [19-21]. M.M. Massin et al. reported that certain time and frequency domain indices correlate so strongly with each other that they can act as surrogates for each other [19].
From time domain measures of HRV we analyzed only the mean HR. Index S strongly differs from other measures. Studying the athletes, V.P. Da Silva et al. revealed that time domain measures are more informative than frequency domain ones for assessment of cardiovascular autonomic adaptation [23].
The mean HR can be considered as a summary result of efficiency of heart autonomic control. Together with left ventricle ejection fraction and peripheral vascular resistance the HR plays the major role in achieving and maintaining optimal BP level that is one of the main goals of cardiovascular control. HR and its time dynamics are used by some authors as the main non-invasive index for dynamic autonomic cardiovascular control in different subjects (for example, athletes, hypertensive patients, patients with diabetes) [24-27] and assessment of executive function score (for example, in elderly hypertensive subjects) [28].
We have shown that mean HR is associated strongly with all other analyzed autonomic indices in each healthy subject in our study. However, the mean HR shows lower correlation with index S characterizing the synchronization of 0.1-Hz cardiovascular rhythms. The analysis carried out for the entire group of subjects gives different results. We assume that the mean HR is the result of multiple interactions between various autonomic indices, but the features of these interactions are different in healthy subjects and cannot be compared. The problem of comparing the internal features of cardiovascular autonomic control in different people is not solved.
The high correlation observed between LF and HF is caused by individual variability of total power of HRV spectrum among studied healthy subjects. Similar correlation was found also by other authors [20]. LF% and HF% are more independent indices, but they depend on total power of HRV spectrum. Note that LF and HF have higher individual correlation with mean HR than LF% and HF% (Table 2). M. Pagani and A. Malliani have discussed which index LF (in ms2 or normalized units) is more associated with baroreflex [29]. The ration LH/HF is widely used for cardiac sympathovagal balance assessment, but it has been criticized by some authors [30]. The interpretation of LF% and HF% is controversial. The assumption that LF% characterizes the same autonomic processes as LF and that HF% is practically the same as HF is not tenable [31]. The nature of these frequency domain indices needs clarification.
The decrease of quality of 0.1-Hz cardiovascular synchronization after 100 minutes of immobilization test in subjects with initial high level of index S may be associated with some disruption of internal interactions within the cardiovascular autonomic control. Immobilization can be considered as the external stress factor for CVS. This fact has potential value for future studies of CVS.
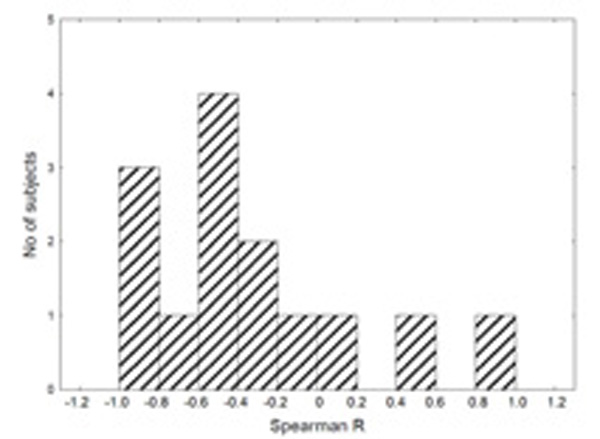
Distribution of values of Spearman correlation coefficients R between the LF and mean HR during the two-hour immobilization test in healthy subjects.
CONCLUSION
Cardiovascular autonomic control is characterized by a pronounced variability among healthy subjects and stability in time in each subject. Many autonomic indices correlate between themselves in a single subject, but such correlations are not revealed during the analysis of indices in a group of subjects.
The mean HR may be regarded as the index of summary result of efficiency of heart autonomic control. Index S is the most independent autonomic index which characterizes systemic autonomic control assessed by cardiovascular synchronization at 0.1-Hz.
We have not found any regularity in variation of cardiovascular autonomic indices during the two-hour immobilization test in healthy subjects.
Study limitations
Our study included only 14 healthy subjects. It is a rather small sample.
We don’t analyze many time domain HRV indices in our study. However, some of time and frequency domain indices are surrogates for each other [19]. In our study, the frequency domain HRV indices were used for assessment of heart autonomic control.
List of ABBREVIATIONS
| BP | = blood pressure |
| CVS | = cardiovascular system |
| ECG | = electrocardiogram |
| HF | = high-frequency |
| HR | = heart rate |
| HRV | = heart rate variability |
| LF | = low-frequency |
| PPG | = photoplethysmogram |
CONFLICT OF INTEREST
The authors confirm that this article content has no conflict of interest.
ACKNOWLEDGEMENTS
This study was supported by the President of the Russian Federation, Grant No. MK-6306.2014.7, and Grant No. MD-4368.2015.7.