All published articles of this journal are available on ScienceDirect.

Intraobserver and Interobserver Reproducibility for Radial, Circumferential and Longitudinal Strain Echocardiography
Abstract
Objectives:
Strain echocardiography (StE) promises to be a new tool for quantitative assessment of cardiac function. Analysis of intra- and interobserver reliability is an important aspect in the process of developing these novel techniques from theory to the implementation into daily routine diagnostics.The purpose of the study was to estimate reliability of the segmental StE.
Methods:
Left ventricular strain analysis for radial strain (RS), circumferential strain (CS) and longitudinal strain (LS) was performed in 21 healthy volunteers. RS and CS values were obtained in the parasternal short axis at the level of the papillary muscles. LS values were determined in the apical 2-, 3- and 4-chamber views. Cine-loops were recorded and quantitative analyses were conducted on an off-line workstation.
Results:
Intraobserver reproducibility was highest using LS in the 4-chamber view (9 ± 13.6 % mean deviation, rho = 0.624, p = 0.003), followed by CS (13.3 ± 8.3 %, rho = 0.406, p = 0.068) and lowest in RS (26.3 ± 30.1 %, rho = 0.391, p = 0.080). Interobserver analyses of LS derived from 3-chamber view showed lowest deviation (11.9 ± 9.5 %, rho = 0.513, p = 0.017), followed by CS (15.2 ± 12.0 %, 0.263, p = 0.249) and the least consistent measurements in RS (35.9 ± 46.3 %, rho 0.382, p = 0.088).
Conclusion:
This study shows that the clinical utility of StE depends on the regional differences of LV wall motion and image quality. LS-values showed promising intra- and interobserver reproducibility values. For quantitative follow-up studies LS should be preferred.
INTRODUCTION
Strain echocardiography was first described in clinical studies of isolated heart muscle in 1973 as deformation [1]. Recent studies have shown great advantages of strain echocardiography in the diagnosis of ischemia using strain technology [2, 3] or in early detection of cardiotoxicity in chemotherapy treated patients. Studies at rest using StE [4, 5] seem to be sufficient to recognize cardiotoxicity in comparison to earlier studies using stress testing [6]. Other studies in patients with mechanical dyssynchrony provide further quantitative information about systolic cardiac function [7, 8]. Strain Echocardiography is an easily applicable, powerful diagnostic tool for the assessment of LV function [9, 10]. Since its in vitro testing [11] strain technology promises a great advantage in global and regional assessment of myocardial function [12, 13]. Strain measurements of regional and global cardiac function show early signs of heart failure [14, 15] and feature the predictors of outcome. Ferferieva et al. [13] reported successfully measurements of intrinsic myocardial function in mice hearts with relative high interobserver deviation up to 21.0%±15.2 for radial strain rate. Generally, echocardiography bears limitations such as subjective interpretation [16] and known interobserver variability [17]. Despite the reported high accuracy of strain echocardiography in the diagnosis of ischemia in coronary disease [3, 18] the sensitivity and specifity can be affected by multiple factors [19]. The problem of interobserver variability isknown from stress echocardiography studies [16, 17]. In most cases suboptimal image quality and decreased detection of the endocardial border led to diminished accuracy of exercise echocardiography. The inter-institutional observer variance in the interpretation of stress echocardiography differed from 100 % to 43 % agreement in stress echocardiograms with the lowest image quality [20]. Similar problems can be expected using strain echocardiography. All novel techniques in echocardiography promise new advantages [21], but they have to stand the test in the daily routine diagnostic.
The purpose of the present study was to examine the reproducibility of left ventricular radial (RS), circumferential (CS) and longitudinal strain (LS) values (global strain).
METHODS
Patients and Study Procedure
21 healthy volunteers – 9 males and 12 females – were included in the study (mean age 32.6 ± 14.3 years, mean weight 69.6 ± 12.1 kg, mean height 172.7 ± 8.5 cm). Echocardiographic studies were performed with a commercially available ultrasound device (Vivid 7 Dimension® by General Electrics (GE) Medical Systems) in a semi supine position using a standard echocardiography table (Ergoline), which enables left side tilting from 0 to 45 degrees. Two-dimensional images were obtained with a commercially available mechanical sector scanner (Matrix Array) with a transducer frequency from 1.5 to 4.3 MHz. The data was transferred by a local network to a storage device. Subsequently, the images were analyzed with offline-workstation software (EchoPAC Dimension 5.2.0, GE Medical Systems).
After a general, transthoracic echocardiographic study, two-dimensional wall motion analysis was performed in maximal expiration to improve image quality. Conventional B-mode was used in order to measure LV deformation utilizing strain imaging. Images were recorded in the standard cross-sectional apical 2-, 3- and 4-chamber views as well as in the parasternal short axis at the level of the papillary muscles. The best imaged three to five cardiac cycles were digitalized in the cine-loop format and synchronized to a 4-lead ECG. The frame rate was set to 60 to 80 frames per second.
Subsequently, the data was post-processed in order to obtain segmental and global strain values of LV wall motion. The cine-loop with the best image quality was chosen and a region of interest (ROI) was selected at the timing of end-diastole, tracing the inner lining of the endocardium and adjusting the ROI to the correct width of the myocardium. Two-dimensional vectors are calculated for each segment of the respective LV regions and strain values are displayed numerically and graphically. The entire process of post-processing took an average of 10-15 minutes per patient.
In order to assess inter-observer variability, two experienced echocardiographers performed the exact same procedure of measuring peak LV strain values as described above in all patients in a blinded manner. One of the echocardiographers repeated the measurements in a randomly selected order on a different day in order to determine the intra-observer variability. The protocol was approved by the Ethics Committee of the University of Witten/Herdecke and all participants were thoroughly informed about the procedure and signed a consent.
Data Analysis and Statistics
Intra- and interobserver reliability of speckle-tracking wall motion analysis was analyzed by describing difference, absolute difference and percentage of deviation of the repeated measures in the healthy group. Spearman’s rank correlation coefficient, limits of agreement, mean difference and 95 % confidence intervals for the mean difference of the measures were also utilized to assess reproducibility. Scatter-plots illustrate similarities and differences of the repeated measurements. The Wilcoxon matched-pairs signed-rank test was used to test the variability of the measurements.
RESULTS
Intraobserver Variability
In order to determine the intraobserver variability of StE derived from LV peak radial, circumferential and longitudinal strain values, the results of measurement one were subtracted from the results of measurement two. Scatter plots show the highest degree of agreement in LS in the 4-chamber view Fig. (1) and Fig. (2).
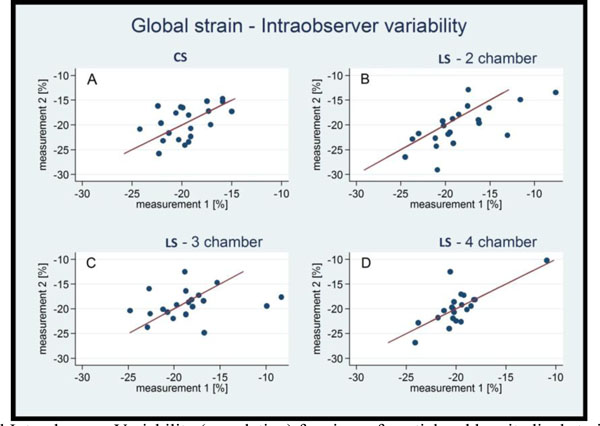
Circumferential Intraobserver Variability (correlation) for circumferential and longitudinal strain values.
CS: circumferential strain, LS-2 chamber: longitudinal strain in 2 chamber view, LS-3chamber: longitudinal strain in 3 chamber view, LS-4 chamber: longitudinal strain in 4 chamber view.
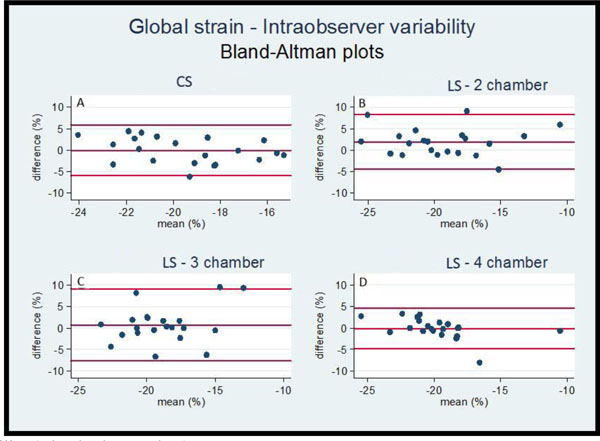
Intraobserver Variability (Bland-Altman plots).
Intraobserver variability (Bland-Altman analysis) for circumferential and longitudinal strain values.
CS: circumferential strain, LS-2 chamber: longitudinal strain in 2 chamber view, LS-3chamber: longitudinal strain in 3 chamber view, LS-4 chamber: longitudinal strain in 4 chamber view.
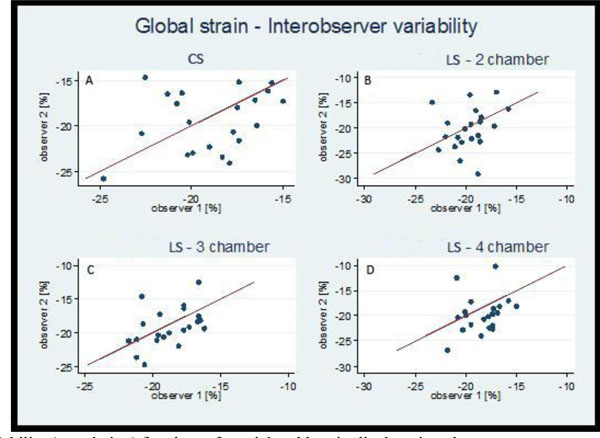
Interobserver Variability (correlation) for circumferential and longitudinal strain values.
CS: circumferential strain, LS-2 chamber: longitudinal strain in 2 chamber view, LS-3chamber: longitudinal strain in 3 chamber view, LS-4 chamber: longitudinal strain in 4 chamber view.
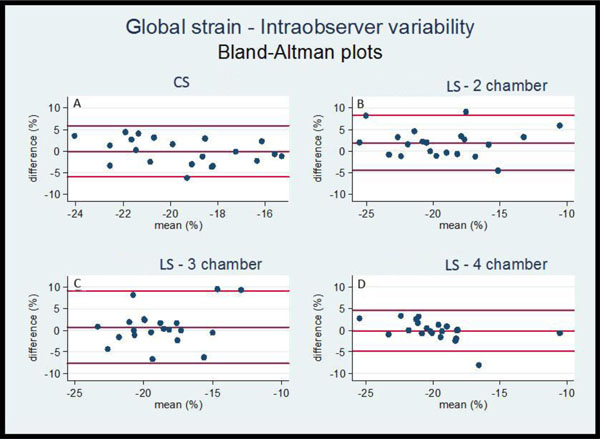
Interobsever Variability (Bland-Altman plots), Intraobserver variability (Bland-Altman analysis) for circumferential and longitudinal strain values.
CS: circumferential strain, LS-2 chamber: longitudinal strain in 2 chamber view, LS-3chamber: longitudinal strain in 3 chamber view, LS-4 chamber: longitudinal strain in 4 chamber view.
Table 1 shows the differences between the two measurements by one single observer. Intraobserver analyses demonstrated for example in 4 chamber view for LS a 9% ± 13.6 % deviation, followed by 13.3% ± 8.3% deviation of CS. In contrast, RS (average value) deviates to the highest extent (26.3 ± 30.1 %). The best Spearman`s coefficients were achieved for 2 and 4 chamber view (rho 0.713, p= 0.000 and 0.624, p = 0.003).
Intraobserver variability.
| Percentage of deviation of measurements observer 1 to observer 2 | |||
|---|---|---|---|
| Strain | mean | sd | median |
| Global circumferential strain | 15.2 | 12.0 | 14.5 |
| Global longitudinal strain 2 chamber view | 15.2 | 15.3 | 12.2 |
| Global longitudinal strain 3 chamber view | 11.9 | 9.5 | 9.7 |
| Global longitudinal strain 4 chamber view | 17.7 | 17.8 | 12.1 |
| Anteroseptal radial strain (RS 1) | 41.3 | 45.5 | 32.6 |
| Anterior radial strain (RS 2) | 46.3 | 54.9 | 27.4 |
| Lateral radial strain (RS 3) | 39.6 | 41.3 | 31.4 |
| Posterior radial strain (RS 4) | 44.9 | 82.0 | 26.4 |
| Inferior radial strain (RS 5) | 83.6 | 259.7 | 21.8 |
| Septal radial strain (RS 6) | 40.2 | 45.0 | 30.8 |
| Mean radial strain (average from RS 1-RS 6) | 35.9 | 46.3 | 25.7 |
| Spearman's rank correlation coefficients (rho) of observer 1 and observer 2 | |||
| Strain | n | rho | p-value |
| Global circumferential strain | 21 | 0.263 | 0.249 |
| Global longitudinal strain 2 chamber view | 21 | 0.333 | 0.141 |
| Global longitudinal strain 3 chamber view | 21 | 0.513 | 0.017 |
| Global longitudinal strain 4 chamber view | 21 | 0.403 | 0.070 |
| Anteroseptal radial strain (RS1) | 20 | 0.525 | 0.018 |
| Anterior radial strain (RS2) | 20 | 0.456 | 0.044 |
| Lateral radial strain (RS3) | 20 | 0.390 | 0.085 |
| Posterior radial strain (RS4) | 20 | 0.298 | 0.201 |
| Inferior radial strain (RS5) | 20 | 0.565 | 0.009 |
| Septal radial strain (RS6) | 20 | 0.406 | 0.076 |
| Mean radial strain:(average from RS1-RS6) | 21 | 0.382 | 0.088 |
mean = average strain values, sd = standard deviation, n = number of participants
rho = correlation coefficient
Interobsever variability.
| Percentage of deviation of measurements observer 1 to observer 2 | |||
|---|---|---|---|
| mean | sd | median | |
| Global circumferential strain | 15.2 | 12.0 | 14.5 |
| Global longitudinal strain 2 chamber view | 15.2 | 15.3 | 12.2 |
| Global longitudinal strain 3 chamber view | 11.9 | 9.5 | 9.7 |
| Global longitudinal strain 4 chamber view | 17.7 | 17.8 | 12.1 |
| Anteroseptal radial strain (RS1) | 41.3 | 45.5 | 32.6 |
| Anterior radial strain (RS2) | 46.3 | 54.9 | 27.4 |
| Lateral radial strain (RS3) | 39.6 | 41.3 | 31.4 |
| Posterior radial strain (RS4) | 44.9 | 82.0 | 26.4 |
| Inferior radial strain (RS5) | 83.6 | 259.7 | 21.8 |
| Septal radial strain (RS6) | 40.2 | 45.0 | 30.8 |
| Mean radial strain (average from RS1-RS6) | 35.9 | 46.3 | 25.7 |
| Spearman's rank correlation coefficients (rho) of observer 1 and observer 2 | |||
| n | rho | p-value | |
| Global circumferential strain | 21 | 0.263 | 0.249 |
| Global longitudinal strain 2 chamber view | 21 | 0.333 | 0.141 |
| Global longitudinal strain 3 chamber view | 21 | 0.513 | 0.017 |
| Global longitudinal strain 4 chamber view | 21 | 0.403 | 0.070 |
| Anteroseptal radial strain (RS1) | 20 | 0.525 | 0.018 |
| Anterior radial strain (RS2) | 20 | 0.456 | 0.044 |
| Lateral radial strain (RS3) | 20 | 0.390 | 0.085 |
| Posterior radial strain (RS4) | 20 | 0.298 | 0.201 |
| Inferior radial strain (RS5) | 20 | 0.565 | 0.009 |
| Septal radial strain (RS6) | 20 | 0.406 | 0.076 |
| Mean radial strain:(average from RS1-RS6) | 21 | 0.382 | 0.088 |
mean = average strain values, sd = standard deviation, n = number of participants, rho = correlation coefficient
Interobserver Variability
Interobserver analysis showed similar patterns of reproducibility as achieved by intraobserver test. The apically derived LS values Fig. (3) and Fig. (4) revealed a higher degree of scattering along the angle bisector than the results for CS,which was estimated in the short axis.
The results for interobserver variability are visualized in the Table 2. The highest agreement of strain values was achieved now in 3-chamber view (11.9 ± 9.5% deviation), followed by CS (15.2 ±12.0 %) and LS in 2-chamber view (15.2 ± 12.2%), the estimated RS-values deviated most strongly from each other,the most up to 35.9% ± 46.3%.
DISCUSSION
Segmental analysis applied in the present study showed sufficient reproducibility using the longitudinal views. Today there are different options for application of strain analysis: segmental-manually in 2D [3, 4], automated tracking in 2D (AFI) [9, 22] and automated tracking in 4D [23]. Manual segmental analysis can be used for assessment of all segments, especially when automated tracking is not feasible. The clinical application of 2D-Strain automated tracking has two important caveats. First, the ranges are only pertinent to conventional segmentation. Second, the normal values might only pertain to the equipment used of the respective study [22].
In recent studies StE was proven to be of clinical significance for the assessment of LV regional function, especially longitudinal and circumferential deformation [24]. However, StE derived values show only in the examination of normal segments a sufficient correlation with the visual wall motion analysis [25]. The agreement with the visual analysis regarding the hypokinetic segments was poor (39.9 %) and regarding the akinetic segments (69.4 %) less than satisfactory. Ranges of peak systolic longitudinal strain that best fit the visual segmental score were used to generate the automatic segmental scores [25]. However, the longitudinal 2D-strain wall motion score showed at least good reliability (basal segments 0.80, mid-level 0.87 and 0.80 for apical segments) [25]. 2D-strain analysis was performed with the 18 segments method and contained automatic tissue tracking method [26]. The interobserver reliability of this method regarding the evaluation of hypokinetic segments was low (0.26) [25]. Feigenbaum et al. described the practical automatic assessment of the left ventricular function, based on automatic tissue tracking. In their review only a longitudinal approach was used [9]. Choi at al. described longitudinal 2D-strain at rest to be the best predictor of left main and three vessel disease [18]. This clinical experience could be developed further by the improvement of the analysis software.
Marwick et al. [22] used an automated tracking method and enrolled 242 healthy volunteers to proof the feasibility and the wall motions score assessment by strain echocardiography using only the apical longitudinal 4 chamber view. Sufficient tracking quality was achieved in 192 patients (79 %). Interobserver reproducibility (comparison between study sites) was measured in 253 segments. The mean difference in measurements was 0.24 percentage points, with a 95 % CI between -11.4 % and +11.8 %. 38 Patients underwent re-test within 1 hour. Re-test variability showed 95 % CI between -9.6 % and +9.7 %.
Our study showed a limited reliability of circumferential strain measurements. The reliability of the circumferential strain measurements has physiological limitations. The circumferential deformation twist can hardly be assessed in the same view, because the base descends to the apex [10]. This movement makes the correct measurement in the short axis view impossible due in two different time points or in two different days. For the future we can consider to use the longitudinal views for examination of left or right ventricular function. The need to examine the circumferential view will be reserved for special diseases and individual cases. Kowalski et al. described reverse results [27]. In 40 healthy volunteers the reliability for systolic longitudinal strain was 14.4 and for systolic radial strain about 10% [27].
Seri et al. [12] reported an interobserver circumferential variability of global strain (GS) in the range of 10%, longitudinal GS of 7.5% and radial GS of 13.5%. A 17 segment-model and automated tracking software were used.
In the present study the deformation analysis in the longitudinal direction revealed moderate to good intra- and inter-observer reliability, whereas radial thickening of the myocardial muscle showed a lower degree of reproducibility. Different results are described by Mavinkurve-Grroothuis et al. [23]. The authors described smaller interobserver deviation values for peak strain values in comparison tothe present study. For the longitudinal 2-chamber view 4.4 % variance was estimated and in short-axis view at the mitral valve level 3.3 %, at the papillary muscles level 5.0 %. With respect to our experience it is this a very satisfactory value, but unrealistic in daily routine. Image quality is a major aspect [22]. It is a known fact that the diagnostic value of echocardiographic analyses strongly depends on the degree of accurate visualization [20], especially for the quantitative analysis of LV deformation. In this study, image quality varied among the study participants which on the one hand affected the degree of reproducibility but on the other hand made the study population a realistic reflection of what expects an echocardiographer in real life. The image quality is more important for four-dimensional echocardiography (4D) [28].
Triplane echocardiography (3P) and 4D need only longitudinal views and this technique has good reproducibility between 6 to 10 %, but it is difficult to analyze all segments with similar good quality [28]. Zhu et al. [29] used 3D strain echocardiography for comparison of strain values with sonomicrometry (excellent echo-window quality by the use of an in vitro study). In this study the interobserver reproducibility of strain values was excellent (R2 values using high frame rate were 0.86 for longitudinal strain and 0.86 for circumferential strain) based on the good image quality.
In patients with reduced echocardiographic window, the correct regional analysis is achievable only withconventional 2D-strain or manual segmental strain analysis. The segmental analysis could be important in the analysis of patients with coronary disease [30, 31] or with myocardial hypertrophy [12]. Hypertrophy can show different asymmetric localization [12].
The future assessment of global cardiac function will certainly be improved with 4D- technique, but the limitation will be to obtain a sufficient image quality in all segments. There is a need to use 2D- echocardiography, if there is only one opportunity to achieve only one sufficient ultrasound window. In individual cases, we intend to analyze different segments, and we have to combine the different views and different 2D-/3P-/4D- techniques for optimal assessment of global and regional ventricular function. Global longitudinal strain has the best interobserver reproducibility [32], especially comparing experienced readers [32]. In different clinical situations there will be a need to use segmental analysis [29].
LIMITATIONS OF THE STUDY AND FUTURE DIRECTIONS
One limitation of the study is the small number of patients, but this number may be generally accepted for this purpose (reproducibility study) as previously published [17]. A further factor is the examination of only healthy volunteers according to Marvick et al. [22] or Kowalski et al. [27]. The aim of the study was to evaluate only the reliability of the technology and not further influences of different diseases. Examinations of patients with cardiomyopathies [12], with hypokinetic or akinetic segments might result in a higher intra- or interobserver variability. This important point should be considered in daily routine. This study describes only the intra- and interobserver variability of the segmental analysis. The values of 2D-/4D- strain can vary in a different manner depending to the image quality. The comparison of achieved strain values regarding to these different technologies (2D/4D) would go beyond the scope of this paper. The problem of automatic tissue tracking methods using 2D/4D-echocardiography should be examined in further studies.
CONCLUSION
The validation of strain technology came into being in 2000 by Urheim et al. [33]. It was one important step to the “quantitative future” of echocardiography. 14 years later the progress turns out to be of slower nature as we thought. The problem of the interobserver reproducibility has become smaller, but the deviation of the values between 10 to 20% will remain and should be considered in decision-making. Picanos “human factor” [34] is relevant up to date and even when using strain technology it is important “being expert” [32, 34]. In this study LS-especially in the 2- and 3-chamber view – revealed the highest degree of reproducibility. Further prospective and follow-up studies are needed to evaluate the diagnostic benefit of this quantitative method for the decision-process in specific cohorts of patients.
CONFLICT OF INTEREST
The authors confirm that this article content has no conflict of interest.
ACKNOWLEDGEMENTS
Declared none.