All published articles of this journal are available on ScienceDirect.

Single-Breathhold Four-Dimensional Assessment of Left Ventricular Morphological and Functional Parameters by Magnetic Resonance Imaging Using the VAST Technique
Authors Info & Affiliations
Abstract
Introduction:
The accurate and reproducible assessment of cardiac volumes, function, and mass is of paramount importance in cardiology. In the present study we sought to determine whether the 3D cine-magnetic resonance (MR) technique, using the variable asymmetric sampling in time (VAST) approach, provided an accurate assessment of LV functional parameters when compared with the conventional 2D cine-MR technique.
Methods:
A total of 43 consecutive patients referred for a CMR examination for clinical reasons and 14 healthy volunteers were included in the study. Cine images were acquired using a steady-state free precession pulse sequence. Two different multiphase acquisitions were performed: conventional 2D cine-MR and 3D cine-MR. The short-axis cine images acquired by both cine-MR techniques were used for the quantitative assessment of LV end-diastolic, end-systolic and stroke volumes, LV mass and ejection fraction.
Results:
All CMR examinations were completed successfully, with both cine-MR imaging techniques yielding interpretable diagnostic results in all patients. Regarding the quantitative assessment, Bland-Altman analyses demonstrated a good agreement between the measurements of both cine-MR techniques for all LV parameters. In addition, the agreement between 2D and 3D cine-MR techniques for the qualitative assessment of LV global function was perfect (kappa = 1.0, P<0.001) for the two observers in consensus. The assessment performed by the third independent observer also demonstrated very good agreement (kappa = 0.88, P<0.001).
Conclusion:
The single breathhold 3D cine-MR technique provides an accurate and reproducible quantitative assessment of LV volumes, mass and function when compared with the conventional 2D cine-MR method.
1. INTRODUCTION
The accurate and reproducible assessment of cardiac volumes, function, and mass is of paramount importance in cardiology. It provides fundamental diagnostic and prognostic information in all patients with cardiovascular disease regardless of etiology [1-3]. Currently, two-dimensional transthoracic echocardiography is the most commonly used diagnostic modality for the assessment and serial measurement of ventricular volumes and function, as it is noninvasive and widely available [4]. However, echocardiography is known to be operator-dependent and to suffer from limitations secondary to inadequate acoustic windows [5, 6].
More recently, cardiovascular magnetic resonance (CMR) imaging has been shown to provide accurate and reproducible quantification of ventricular volumes, mass and function [7-12]. Given its three-dimensional nature, which does not rely on geometric assumptions, CMR has become the clinical gold standard against which other techniques are compared [13]. Moreover, CMR has been shown to be valuable for the assessment of regional contractile function as well [6, 14, 15]. This is usually achieved clinically by visual inspection of cines in standard imaging planes. Quantification of wall motion and thickening using conventional techniques is possible for both the left and right ventricles.
Current CMR techniques, however, are based on two-dimensional (2D) image acquisition protocols and, therefore, require multiple time-consuming short-axis views for complete coverage of the heart [8, 16]. Moreover, as these 2D imaging techniques typically acquire one or two slices or sections per breath-hold, there exists the possibility of misregistration between acquisitions. Recently, three-dimensional (3D) multiphase acquisitions have been proposed [17-21]. The 3D approach is very appealing because it allows for the acquisition of all slices in a single breath-hold; thereby minimizing not only the possible slice-to-slice misregistration artifacts but also the overall scan time for a ventricular function study. These 3D protocols have become much more clinically applicable after the development of image acquisition acceleration techniques, such as the dynamic variant of the broad-use linear acquisition speed-up technique (k-tBLAST) [22-25] or the variable asymmetric sampling in time (VAST) approach [26, 27], which have led to a substantial decrease in scan time.
In the present study we sought to determine whether the 3D cine-MR technique, using the variable asymmetric sampling in time (VAST) approach, provided an accurate assessment of LV morphological and functional parameters when compared with the conventional 2D cine-MR acquisition technique. More specifically, we investigated the correlation between same-patient 2D and 3D cine-MR acquisitions regarding the assessment of LV volumes, mass and function in a series of patients referred for a CMR study and in a group of normal volunteers. In addition, the assessment of regional contractility by both 2D and 3D cine-MR techniques and the total scan time required to complete the LV functional assessment were also compared.
2. METHODS
2.1. Population
A total of 43 consecutive patients referred for a CMR examination for clinical reasons (mean age = 51 ± 16 years; 27 men) and 14 healthy volunteers without a previous history of cardiovascular disease (mean age = 30 ± 4 years; 10 men) were included in the study. The clinical reasons that motivated the CMR study were variable and included: assessment of coronary atherosclerotic disease (CAD) (n = 24, five of whom had a previous acute myocardial infarction), arrhythmogenic right ventricular cardiomyopathy (n = 4), valvular heart disease (n = 4), hypertensive cardiomyopathy (n = 3), idiopathic dilated cardiomyopathy (n = 2), endomyocardial fibrosis (n = 1), Chagas disease (n = 1), hemochromatosis (n = 1), hypertrophic cardiomyopathy (n = 1), pericardial disease (n = 1) and heart transplant (n = 1). Patients were excluded from the study if they had contraindications for CMR examination, such as non-compatible implants, metallic fragments in the eyes or claustrophobia. The study was approved by the Institutional Ethics Committee and all subjects gave written informed consent.
2.2. MRI Protocol
All subjects underwent CMR imaging using a 1.5T clinical scanner (Signa CV/I, GE Medical Systems, Waukesha, WI) with a dedicated cardiac phased-array receiver coil wrapped around the chest. Cine images were acquired using a steady-state free precession pulse sequence. Two different multiphase acquisitions were performed: conventional 2D cine-MR and 3D cine-MR.
2.3. 2D Cine-MR
After localization of the heart, 8 to 12 contiguous short-axis slices were prescribed to cover the entire LV from base to apex. Four long-axis slices were also prescribed: a 4-chamber view, an LV outflow tract view, and two 2-chamber views. Imaging parameters were as follows: repetition time 3.9 milliseconds, echo time 1.6 milliseconds, flip angle = 45º, 32- to 36-cm field-of-view (FOV), 8-mm slice thickness, 2-mm gap, acquisition matrix size = 256 × 160, rectangular FOV = 0.75, 8 to 16 views per segment, NEX = 1, voxel size = 1.25 x 2 x 8 mm, temporal phases per scan location = 20.
2.4. 3D Cine-MR
In the present study the 3D cine-MR dataset was acquired using the VAST scheme [26, 27]. This acquisition scheme is similar to the “block regional interpolation for k-space” (BRISK) proposed by Doyle et al. [28]. As previously described, VAST samples the low spatial frequency at a higher temporal resolution than the higher spatial frequency data, thereby reducing the total scan time. The low spatial frequency data were acquired using two views per segment, where a segment represents a data acquisition block in a cardiac ECG R-R wave interval. In the spatial encoding scheme used, each view is a ky-encoding value and consists of Nz slice encoding views, where Nz represents the number of partitions in the 3D volume acquisition. Data acquisition of each segment is repeated until the next cardiac R-wave trigger is encountered where the next set of ky phase encoding values are updated. In this implementation, high spatial frequency data were acquired using four views per segment. The temporal resolution of the 3D cine-MR dataset was calculated as: Tres = VPS * Nz * TR, where Tres denotes temporal resolution, VPS are the number of Kz encoding views in a R-R interval and TR denotes the sequence repetition time.
We also used partial phase field-of-view (pFOV) in our 3D cine-MR protocol, which further decreased the overall scan time by decreasing the number of acquired ky encoding views. In addition, retrospective interpolation was used to reconstruct 20 temporal phases per slice partition [29]. As data acquisition was continuous, there was no dead time in the cardiac R-R interval with the continuous cardiac motion of end-diastole through the start of systole well represented. The 3D cine-MR imaging parameters were as follows: repetition time 4.9 milliseconds, echo time 2.7 milliseconds, flip angle = 45º, 40-cm field-of-view (FOV), 12 partitions per volume acquisition, 8- to 10-mm partition thickness, no gap, acquisition matrix size = 256 × 128, rectangular FOV = 0.8 to 0.9, number of views per segment calculated automatically depending on the heart rate, NEX = 0.5, typical voxel size = 1.56 x 3.12 x 8 mm, temporal phases per scan location = 20.
The total time required to complete the acquisition of the entire short-axis dataset used for LV morphological and functional assessment was computed for both techniques. In the case of 2D cine-MR this parameter included the time expended in the actual acquisition of the images (during the multiple breathholds) and the time expended between breathholds while the patients rested in preparation for the next respiratory pause. In contrast, since 3D cine-MR acquisition consisted of a single breathhold, this parameter was equal to the time required to complete the single acquisition period (breathhold time).
2.5. MRI Data Analyses
The short-axis cine images acquired by both cine-MR techniques were used for the quantitative assessment of LV end-diastolic volume (EDV), LV end-systolic volume (ESV), LV stroke volume (SV), LV mass and LV ejection fraction (EF). All analyses were performed using a dedicated software package (Mass, Medis, Leiden, The Netherlands). Endocardial borders were manually contoured in cine short-axis slices at end-diastolic and end-systolic phases and calculations were based on Simpson’s Rule Method. Papillary muscles were excluded from the LV volume and considered to represent LV lumen. Additionally, end-diastolic epicardial borders were manually traced and LV mass was calculated by assuming a myocardial tissue density of 1.05 g/cm3. All analyses were based on the consensus opinion of two observers (CER and MR) and were also performed by a third independent investigator (MHAS) for the assessment of inter-observer variability.
Global LV function was also qualitatively evaluated in all subjects and graded as: 0- normal; 1- mild dysfunction; 2- moderate dysfunction; and 3- severe dysfunction. In addition, the semi-quantitative visual assessment of regional LV contractility was also performed. The segmental wall motion analysis was performed on 17 standardized segments of the LV [30] and was graded as: 0- normal contractility; 1- mild or moderate hypokinesia; 2- severe hypokinesia; 3- akinesia; and 4- dyskinesia.
With both cine-MR techniques, a qualitative patient-based analysis of overall image quality was performed and graded on a five-point scale: 1- excellent; 2- good; 3- moderate; 4- poor; and 5- non-diagnostic. This subjective scoring system was based on the ability of the investigator to visually identify the LV endocardial and epicardial borders.
In addition, the objective quantitative assessment of image quality was also performed in a subgroup of 10 patients. LV myocardium and blood-pool signal-to-noise ratios (SNR), and myocardium-blood contrast-to-noise ratios (CNR) were calculated for both cine-MR techniques. For each subject, three measurements were made on the mid-ventricular short-axis slice; two on the end-diastolic phase image and one on the end-systolic phase image. The three measurements were subsequently averaged to obtain one single measurement per subject. For the quantification of LV myocardial signal intensity (SI), a region of interest (ROI) was defined on the LV septum. For blood-pool measurements, the largest circular ROI that contained only intraventricular blood was defined on the same short-axis image. Image noise was defined as the standard deviation (SD) of SI measured in the air outside the body. The myocardial and blood-pool SNRs were calculated as: SNRmyo = (SImyo * 1.5)/SDair and SNRblood = (SIblood * 1.5)/SDair, respectively. The myocardium-blood CNR was calculated as: CNRmyo-blood = (SIblood – SImyo)/SDair [31].
2.6. Statistical Analysis
Student's t-tests and Wilcoxon signed rank test were used to compare continuous variables, which were expressed as mean ± SD. Linear regression analyses were used to evaluate the relationship between the values of morphological and functional LV parameters measured by both 2D and 3D cine-MR techniques. In addition, Bland-Altman analyses [32] were used to assess the agreement between the measurements obtained by both cine-MR techniques. The interobserver variability of continuous variables measurements was also examined by the Bland-Altman technique, with the calculation of repeatability coefficients for both cine-MR techniques [32, 33]. The agreement between 2D and 3D cine-MR techniques for categorical variables was evaluated by the kappa statistic. All tests were 2-tailed and a value of P<0.05 was considered indicative of statistical significance.
3. RESULTS
3.1. 2D and 3D Cine-MR Characteristics
All CMR examinations were completed successfully, with both cine-MR imaging techniques yielding interpretable diagnostic results in all patients (Fig 1). The mean scan time to acquire the eight to twelve slice locations using the 2D cine-MR technique was 470 ± 158 seconds, or approximately 7 minutes and 50 seconds. In contrast, the scan time required to acquire all slice locations using the 3D cine-MR technique was much lower, consisting of a single breathhold of 24 ± 4 seconds (P < 0.0001 versus 2D cine-MR). The mean heart rate during image acquisition was similar for both cine-MR techniques (70 ± 12 beats per minute for 2D cine-MR and 68 ± 13 beats per minute for 3D cine-MR, P = 0.26). The temporal resolution of the cine-MR datasets, which demonstrated a slight variation depending on the patient’s heart rate during image acquisition, was significantly better in the 2D cine-MR than in 3D cine-MR technique (42 ± 11 ms versus 59 ± 10 ms, P < 0.001).
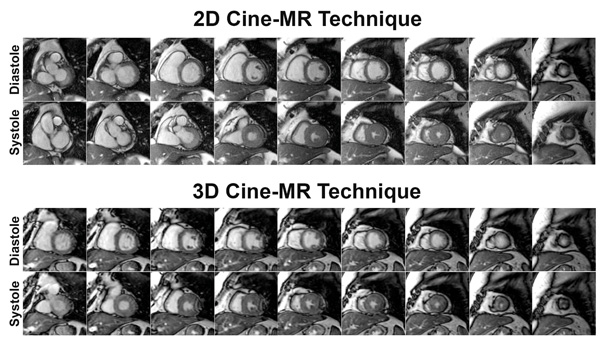
Representative examples of short-axis cine-MR images acquired in the same patient using the 2D (top) and the 3D (bottom) cine-MR techniques. 2D denotes two-dimensional; 3D, three-dimensional; and MR, magnetic resonance.

Linear regression graphs (on the left) and Bland-Altman graphs (on the right) illustrating the excellent correlation and agreement between the values of LV volumes, mass and function obtained with the conventional 2D and the proposed 3D cine-MR techniques. LV denotes left ventricular; 2D, two-dimensional; 3D, three-dimensional; EDV, end-diastolic volume; ESV, end-systolic volume; SV, systolic volume; EF, ejection fraction; and MR, magnetic resonance.
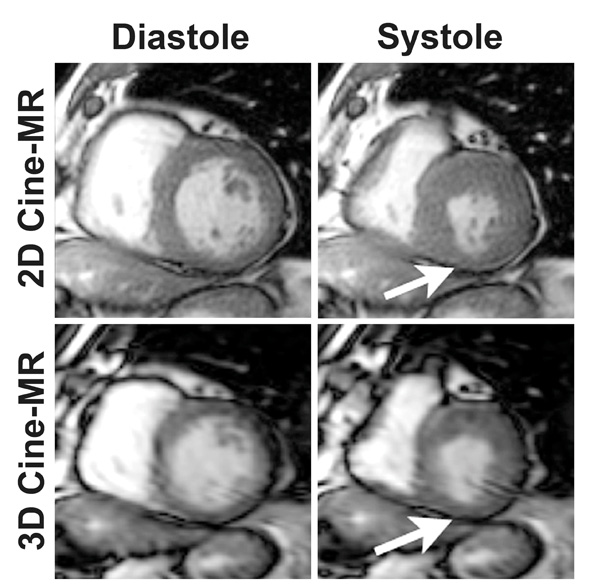
Selected short-axis cine-MR images illustrating the excellent agreement between both cine-MR techniques for the assessment of LV regional function. Note that this patient has a small region of hypokinesia in the inferior LV wall (arrows) that could be easily identified by both the 2D (top) and the 3D (bottom) image acquisition methods. 2D denotes two-dimensional; 3D, three-dimensional; and MR, magnetic resonance.
3.2. Quantitative Assessment of LV Volumes, Mass and Function
Among the 14 normal volunteers, the mean LV EDV, LV SV and LV EF were slightly higher when calculated with the 2D cine-MR than with the 3D cine-MR technique (136 ± 27 ml versus 118 ± 21 ml, P < 0.001 for LV EDV; 94 ± 23 ml versus 78 ± 17 ml, P < 0.001 for LV SV; 69 ± 6% versus 65 ± 5%, P = 0.01 for LV EF). The mean values of LV ESV and LV mass obtained with both cine-MR techniques were similar (41 ± 8 ml versus 41 ± 6 ml, P = 0.68 for LV ESV; 98 ± 25 g versus 95 ± 25 g, P = 0.14 for LV mass). Most importantly, Bland-Altman analyses demonstrated a good agreement between the measurements obtained with both cine-MR techniques for all LV parameters (Table 1).
Comparison Between the Quantitative Assessment of LV Volumes, Mass and Function by the 2D and the 3D Cine-MR Techniques
| Parameter | 2D | 3D | Bias | P | 95% Limits of Agreement | Correlation Coefficient | Linear Regression Equation | P |
|---|---|---|---|---|---|---|---|---|
| Volunteers | ||||||||
| LV EDV (ml) | 136 ± 27 | 118 ± 21 | -18 ± 12 | <0.001 | -41/6 | 0.91 | y = 0.70x + 22.7 | <0.001 |
| LV ESV (ml) | 41 ± 8 | 41 ± 6 | -1 ± 6 | 0.68 | -12/11 | 0.71 | y = 0.57x + 17.1 | <0.001 |
| LV SV (ml) | 94 ± 23 | 78 ± 17 | -17 ± 12 | <0.001 | -41/8 | 0.87 | y = 0.63x + 18.1 | <0.001 |
| LV EF (%) | 69 ± 6 | 65 ± 5 | -3 ± 4 | 0.01 | -12/5 | 0.70 | y = 0.55x + 26.8 | <0.001 |
| LV mass (g) | 98 ± 25 | 95 ± 25 | -3 ± 7 | 0.14 | -18/12 | 0.96 | y = 0.96x + 0.4 | <0.001 |
| Patients | ||||||||
| LV EDV (ml) | 165 ± 83 | 149 ± 81 | -16 ± 17 | <0.001 | -50/18 | 0.98 | y = 0.95x - 8.2 | <0.001 |
| LV ESV (ml) | 83 ± 80 | 81 ± 77 | -2 ± 10 | 0.23 | -22/18 | 0.99 | y = 0.96x + 1.2 | <0.001 |
| LV SV (ml) | 82 ± 28 | 68 ± 25 | -14 ± 14 | <0.001 | -43/15 | 0.86 | y = 0.76x + 5.4 | <0.001 |
| LV EF (%) | 56 ± 18 | 52 ± 18 | -4 ± 6 | <0.001 | -15/8 | 0.95 | y = 0.92x + 0.9 | <0.001 |
| LV mass (g) | 139 ± 52 | 138 ± 48 | 0 ± 19 | 0.99 | -39/38 | 0.93 | y = 0.85x + 19.2 | <0.001 |
LV denotes left ventricular; 2D, two-dimensional; 3D, three-dimensional; EDV, end-diastolic volume; ESV, end-systolic volume; SV, systolic volume; and EF, ejection fraction.
Comparison Between the Quantitative Assessment of LV Volumes, Mass and Function by the 2D and the 3D Cine-MR Techniques
| Mean Difference Between Both Observers (Bias) | Coefficient of Repeatability | |||||
|---|---|---|---|---|---|---|
| Parameter | 2D | 3D | P* | 2D | 3D | P** |
| LV EDV (ml) | 0.5 | 8.3 | 0.06 | ± 24.0 | ± 17.1 | 0.32 |
| LV ESV (ml) | 0.2 | 6.6 | 0.05 | ± 20.0 | ± 9.0 | 0.03 |
| LV SV (ml) | 0.6 | 0 | 0.88 | ± 21.4 | ± 27.1 | 0.49 |
| LV EF (%) | 1.5 | -2.4 | 0.05 | ± 10.5 | ± 8.9 | 0.65 |
| LV mass (g) | 13.8 | 14.6 | 0.85 | ± 27.6 | ± 12.7 | 0.03 |
* P value of the Student’s t test for the 2D versus the 3D mean differences (bias)
** P value of the two-sample variance-comparison test for the 2D versus 3D repeatability coefficients
LV denotes left ventricular; 2D, two-dimensional; 3D, three-dimensional; EDV, end-diastolic volume; ESV, end-systolic volume; SV, systolic volume; and EF, ejection fraction.
Among the 43 patients, the mean LV EDV, LV SV and LV EF were also slightly higher when calculated with the 2D cine-MR than with the 3D cine-MR technique (165 ± 83 ml versus 149 ± 81 ml, P < 0.001 for LV EDV; 82 ± 28 ml versus 68 ± 25 ml, P < 0.001 for LV SV; 56 ± 18% versus 52 ± 18%, P < 0.001 for LV EF). The mean values of LV ESV and LV mass obtained with both cine-MR techniques were similar (83 ± 80 ml versus 81 ± 77 ml, P = 0.23 for LV ESV; 139 ± 52 g versus 138 ± 48 g, P = 0.99 for LV mass). Most importantly, Bland-Altman analyses demonstrated a good agreement between the measurements obtained with both cine-MR techniques for all LV parameters (Table 1 and Fig. 2).
Overall, both cine-MR techniques demonstrated good reproducibility. The results related to the interobserver variability of both cine-MR techniques, for all LV parameters evaluated, are summarized in Table 2. Even though the bias was slightly better for the 2D technique in the quantification of LV EDV, LV ESV and LV EF, the repeatability coefficients (variance) were slightly better for the 3D technique in the assessment of LV ESV and LV mass. In general, however, the reproducibility of both cine-MR techniques was similar (Table 2).
3.3. Qualitative Assessment of LV Global Systolic Function
The two observers in consensus classified, based on the analyses of both cine-MR datasets, 29 patients as having normal LV function (67%), 2 with mild LV dysfunction (5%), 5 with moderate LV dysfunction (12%) and 7 with severe LV dysfunction (16%). The agreement between 2D and 3D cine-MR techniques for the qualitative assessment of LV global function was perfect (kappa = 1.0, P < 0.001) for the two observers in consensus. The assessment performed by the third independent observer also demonstrated very good agreement (kappa = 0.88, P < 0.001); there were only 3 discordant results (one mild dysfunction classified as normal, one mild classified as moderate, and one moderate classified as severe dysfunction, by the 2D and 3D techniques, respectively).
3.4. LV Regional Function
The assessment of segmental wall motion using the 2D cine-MR dataset resulted in 575 segments (78%) exhibiting normal contractile function, 102 segments (14%) exhibiting mild/moderate hypokinesia, 15 segments (2%) showing severe hypokinesia, 33 segments (5%) with akinesia, and 6 segments (1%) showing dyskinesia. The results with the 3D dataset were similar: 572 segments (78%) with normal contractile function, 102 segments (14%) with mild/moderate hypokinesia, 21 segments (3%) with severe hypokinesia, 30 segments (4%) with akinesia, and 6 segments (1%) with dyskinesia. Indeed, the agreement between both cine-MR techniques for the assessment of regional LV function was excellent (kappa = 0.94, P < 0.001) (Fig. 3). The agreement was perfect in 34 patients (79%) and there were only 17 discordant segments in the remaining 9 patients.
3.5. Image Quality
The qualitative assessment of the 2D cine-MR dataset revealed that the overall image quality was very good, with 38 studies (88%) exhibiting excellent image quality and 5 studies (12%) demonstrating good image quality. The results of the qualitative assessment of the 3D cine-MR dataset revealed 26 studies (60%) with excellent image quality, 10 studies (23%) with good image quality, 5 studies (12%) with moderate image quality and 2 studies (5%) with poor image quality. Even though the results were not as good as those observed with the 2D technique, most 3D cine-MR studies were of excellent/good image quality, only 2 demonstrated poor image quality and there weren’t any studies classified as non-diagnostic. The mean image quality score was significantly better for the 2D than for the 3D cine-MR technique (1.12 ± 0.32 versus 1.60 ± 0.88, P < 0.001).
Based on the quantitative assessment of image quality parameters using the 2D cine-MR dataset, the calculated myocardium SNR was 34 ± 6, the blood-pool SNR was 101 ± 27 and the myocardium-blood CNR was 44 ± 16. Based on the assessment of the 3D dataset, the myocardium SNR was 36 ± 33, the blood-pool SNR was 121 ± 99 and the myocardium-blood CNR was 57 ± 49. All quantitative image quality parameters were similar when both cine-MR techniques were compared (P = 0.83 for myocardium SNR; P = 0.54 for blood-pool SNR; and P = 0.49 for myocardium-blood CNR).
4. DISCUSSION
In the present study we were able to demonstrate that the 3D cine-MR multiphase acquisition with the VAST technique allows for the accurate and reproducible assessment of LV morphological and functional parameters when compared with the conventional 2D technique. The agreement between both cine-MR techniques was very good, not only for the quantitative analyses of LV volumes, mass and function, but also for the qualitative assessment of global and regional LV systolic function. Even though the overall image quality was better for the 2D technique, most studies with the 3D cine-MR method were of excellent image quality and there weren’t any non-diagnostic studies. Most importantly, the use of the proposed 3D technique resulted in a 20-fold reduction in the scanning time required for the assessment of LV morphological and functional parameters.
4.1. Quantitative Assessment
Previous studies have investigated 3D cine-MR techniques for the assessment of LV volumes, mass and function in comparison with conventional 2D cine-MR acquisitions [19, 21-23, 26]. In these previous reports, the agreement between both cine-MR techniques was consistently very good, which is in agreement with our results. Jahnke et al. [23] and Greil et al. [22] used a 3D cine-MR acquisition with the kt-BLAST acceleration technique and investigated 40 consecutive patients with known/suspected CAD and 17 healthy volunteers, respectively. Hamdan et al. also employed the kt-BLAST technique to investigate 23 consecutive patients with known/suspected CAD and demonstrated that the single breathhold 3D cine-MR acquisition could also be performed in a 3T system [24]. Rettmann et al. evaluated LV functional parameters using a technique similar to the one used in the present study, i.e., 3D cine-MR with the VAST acceleration scheme [26]. However, in that study they evaluated only 7 patients with chronic myocardial infarction. The present study was the first to include both normal volunteers and patients with cardiovascular diseases. Most importantly, while previous studies only included patients with known/suspected CAD, the present study investigated a much more representative population, including patients with a wide variety of heart diseases.
Most importantly, in the present study, all Bland-Altman analyses revealed good agreement between the measurements obtained by the 2D and 3D cine-MR methods. As we can see in Fig. (2), the observed bias and limits of agreement are well within the range that is considered clinically acceptable if we take into consideration the inter- and intraobserver variability that is reported in the literature for the conventional 2D technique [34-36].
4.2. Qualitative Assessment
It is widely recognized that, in everyday clinical practice, the subjective qualitative assessment of global LV systolic function is much more frequently used and, to a certain degree, more relevant in a practical point of view than the value obtained from the objective calculation of LV ejection fraction. Nevertheless, it is a fact that most studies that investigated the performance of CMR for the assessment of LV function have focused on the objective quantitative measurements [22-24, 26]. In the present study, in addition to the quantitative analyses, we have also performed a qualitative assessment of LV global systolic function. We were able to demonstrate that the agreement between the 2D and the 3D cine-MR techniques was excellent for the classification of patients as having normal LV function or mild, moderate or severe LV dysfunction. We believe these findings highlight the potential of the 3D cine-MR technique to be useful and applicable in everyday CMR clinical practice.
4.3. Regional Function
The presence of wall motion abnormalities is a frequent finding in a wide variety of cardiovascular diseases. It is particularly common in the setting of ischemic heart disease [15, 37-40], but is also frequent in a large proportion of non-ischemic cardiomyopathies [41-45]. The accurate identification of LV regional dysfunction, as well as the correct assessment of its severity, plays an important role in the diagnostic work-up of these conditions. Moreover, the accurate assessment of regional contractility is particularly important in CMR studies with pharmacological stress for the investigation of myocardial ischemia [15, 46-48]. Our findings indicate that the assessment of regional LV function in a single breathhold using the 3D cine-MR technique can provide accurate and reliable results when compared with the conventional 2D method.
We believe the 3D technique have the potential to be specially useful in the setting of stress CMR studies, in which the patients are required to perform multiple breathholds in each pharmacological stress stage with the conventional 2D technique. It is important to recognize, however, that due to the high heart rates observed during stress CMR studies, it might be necessary to improve the temporal resolution of the 3D technique before it becomes clinically applicable for this particular indication. Future studies investigating the use of the 3D cine-MR method in this specific situation will be necessary to clarify this issue.
4.4. Image Quality
The qualitative assessment of image quality demonstrated that the overall quality was better for the cine-MR images obtained with the 2D technique than for those obtained with the 3D method. This difference was due to the fact that, in some studies, there was a certain degree of blurring of the endocardial and epicardial borders on the 3D images that was not present in the 2D dataset. We believe this image blurring was a result of the worse temporal resolution of the 3D cine-MR technique. Nevertheless, despite this limitation, the vast majority of studies using the 3D acquisition was considered to be of excellent/good image quality (83%). Even more important, all studies with the 3D technique were considered to be of diagnostic image quality. Accordingly, the quantitative parameters of image quality, namely myocardial SNR, blood-pool SNR and myocardial-blood CNR, were similar in the 2D and the 3D cine-MR datasets.
4.5. Limitations
In addition to the aforementioned limitation regarding the temporal resolution of the 3D cine-MR dataset, another important limitation of the present study refers to the fact that we did not employ parallel imaging acceleration techniques [49-51] in our cine-MR acquisitions protocols. Currently, this modality of scan acceleration technique is widely used in most CMR studies as it provides a 2 to 4-fold decrease in scanning time. The trade-off with the use of parallel imaging is a reduction in the image SNR in the order of 40%. As previously demonstrated, parallel imaging techniques can be used in combination with the VAST scheme [26]. However, in the present study we decided to evaluate one particular acceleration strategy: the VAST technique. Therefore, we did not associate parallel imaging in our CMR protocols. Nevertheless, it is important to recognize that, with the combination of VAST and parallel imaging techniques, we could have significantly improved the temporal/spatial resolution and/or decreased the breathhold time of our cine-MR datasets. Indeed, this combination could be especially useful in patients with shortness of breath, for whom a 24-second breathholh time might be too long, potentially resulting in respiratory motion artifacts. We believe future studies evaluating the combination of both acceleration techniques might result in an improvement in the overall image quality of the 3D cine-MR datasets and, possibly, an increase in the accuracy and reproducibility of the 3D technique.
4.6. Conclusion
The single breathhold 3D cine-MR technique provides an accurate and reproducible quantitative assessment of LV volumes, mass and function when compared with the conventional 2D cine-MR method. In addition, the qualitative assessment of global and regional LV systolic function by the 3D technique also demonstrated an excellent agreement with the results obtained with the conventional 2D cine-MR method. Most importantly, the use of the proposed 3D technique resulted in a 20-fold reduction in the scanning time required for the assessment of LV morphological and functional parameters while preserving diagnostic image quality in all cine-MR studies.