All published articles of this journal are available on ScienceDirect.

Effect of Hemodialysis, Coronary Artery Disease and Diabetes on Cardiac Troponin T: A Prospective Survey Over One Year
Authors Info & Affiliations
Abstract
Background:
Limited data is available about the effects of hemodialysis sessions, coronary artery disease (CAD), and diabetes on serum cardiac troponin T (cTnT) levels in patients with end-stage renal disease (ESRD).
Objectives:
To test whether hemodialysis could be associated with an increase in cTnT concentration. To evaluate if coronary artery disease (CAD) or diabetes are associated with higher cTnT levels in ESRD.
Methods:
Serum cTnT levels were measured immediately before and after dialysis 3 times over 1 year (0, 6, and 12 months).
Results:
A total of 100 ESRD patients without acute coronary syndrome (mean age of 58.5 years, 34% with diabetes, and 37% with CAD) gave 267 pre-dialysis and 260 post-dialysis blood samples. The mean (standard deviation) pre-dialysis cTnT levels were 0.06 (0.12), 0.05 (0.06), and 0.07 (0.07) mcg/L at 0, 6, and 12 months, respectively. The post-dialysis cTnT levels were similar on average. Among 259 samples with cTnT measured both before and after dialysis, 79 (30.5%) showed a decrease in serum cTnT, 97 (37.5%) showed an increase and 83 (32%) showed no change following dialysis. Mean cTnT was higher in CAD than in non-CAD patients. We observed no significant difference in mean cTnT levels between diabetic and non-diabetic patients.
Conclusions:
cTnT levels were not affected by individual hemodialysis sessions, and remained stable around 0.06 mcg/L over a 1-year period in ESRD patients. Random cTnT levels were higher in stable CAD patients undergoing hemodialysis.
INTRODUCTION
Cardiovascular mortality in patients on chronic hemodialysis is 10 times higher than that of the general population [1]. Elevated cardiac troponin T (cTnT) is a marker of myocardial cell damage and is associated with a higher cardiovascular risk [2, 3]. It has become the biomarker of choice for the diagnosis of myocardial infarction [4]. More than 10 years ago, elevations of cTnT were reported in patients with chronic kidney disease (CKD) [5]. The debate about the interpretation of elevated cTnT in the presence of abnormal renal function is still ongoing. CKD patients are at risk for silent ischemia [6]. In a specific patient, it is at times difficult to distinguish elevated cTnT due to an acute coronary syndrome (ACS), especially in the context of atypical symptoms, from those elevation presumably associated with CKD, which do not mandate acute cardiac care. Nevertheless, elevated cTnT levels in end-stage renal disease (ESRD) patients have their own clinical relevance since they have consistently been found to be predictive of increased mortality [7-9] There is limited information on the short- and long-term effects of hemodialysis on serum cTnT levels [10]. Hemodynamic stress associated with dialysis could be associated with a transient increase in serum cTnT concentration and repeated hemodialysis sessions could lead to a progressive increase in serum cTnT over time. Coronary artery disease (CAD), diabetes, congestive heart failure and left ventricular hypertrophy have been linked to higher serum cTnT levels in chronic renal failure patients and in the general population [11, 12]. To interpret an elevated serum cTnT level in an individual CKD patient, knowledge of the magnitude of the changes in cTnT that can be expected from his baseline condition would be useful. We also evaluated the impact of CAD or diabetes on cTnT levels in these patients.
METHODS
Research Objectives
The primary objectives were to evaluate the mean serum cTnT level before and after a hemodialysis session and the change in serum cTnT level associated with a hemodialysis session, and to determine the variation in serum cTnT levels over 1 year in a population of ambulatory stable ESRD patients who were not admitted for an ACS during follow-up. We also sought to assess the prevalence of cTnT ≥ 0.07 mcg/L (above the threshold for myocardial necrosis at our institution) in an unselected population of ESRD patients. A secondary objective was to determine the effect of CAD and diabetes on serum cTnT levels in ESRD patients.
Study Population
The protocol was approved by our institutional research and ethics committees. A series of 139 consecutive hemodialysis patients treated at Notre-Dame Hospital, one of the hospitals of the Centre Hospitalier de l’Université de Montréal, were asked to participate in the study. All patients who agreed provided informed consent. Inclusion criteria were that the patient had ESRD requiring chronic hemodialysis, was 18 years of age or older, and was able to understand and sign the consent form. Patients were excluded from the present analysis if they presented an ACS during the 1 year follow-up, because they could no longer be considered stable from a coronary standpoint.
Data Collection and Definitions
Hospital charts and dialysis records were reviewed to collect relevant clinical and laboratory data by one of the authors (FPM). Patients were interviewed at enrolment by the same investigator. A written survey about the occurrence of chest pain or hospitalization in the 2 preceding weeks was administered before each blood samples were taken. CAD was considered present when we could identify a previous myocardial infarction, a previous surgical or percutaneous coronary revascularization, the presence of inducible ischemia on a stress test, or at least 1 coronary stenosis > 50% on any past coronary angiography. We used a sensitive definition of an ACS; it was considered whenever the patient was admitted with symptoms or signs that were thought to be attributable to a cardiac cause, with or without elevated cTnT, with or without ECG changes. Subjects were considered diabetic if they had a history of diabetes mellitus or if they were undergoing therapy with oral hypoglycemic agents or insulin.
Measurement of cTnT and Follow-up
cTnT levels were measured before and after three pre-specified hemodialysis sessions; at enrolment, and at 6 and 12 months post-enrolment. cTnT levels were assayed using a third generation Troponin T STAT assay by Roche Diagnostics (detection limits: 0.01-25.00 mcg/L) [13]. The clinical biochemistry laboratory at our centre has validated the following reference values for our population: normal serum cTnT is < 0.01 mcg/L and threshold for myocardial necrosis is ≥ 0.07 mcg/L .We acknowledge that the package insert for the Roche Diagnostics Troponin T STAT test suggest 0.10 mcg/L as a threshold for diagnosis of myocardial necrosis [13]. Follow-up ended after the third cTnT sample was taken.
Statistical Analysis
Pre- and post-dialysis mean and standard deviation were calculated for cTnT at enrolment, 6- and 12-month follow-up. Pre- and post-dialysis values were compared with a t-test. For each pair of pre- and post-dialysis serum cTnT, the delta (post minus pre) was calculated and deltas were grouped in 0.05 mcg/L strata. To assess the variation in cTnT over 1 year in individual patients, we calculated the delta in pre-dialysis cTnT between enrolment and the 6-month follow-up and between 6 and 12 months of follow-up. Pre- and post-dialysis mean cTnT were computed in subgroups of patients and compared using paired t-tests. Pre- or post-dialysis mean cTnT in patients with CAD and diabetes were compared to pre- or post-dialysis mean cTnT in ESRD patients without these conditions using a 2-sample t-test. Statistical analyses were performed using SAS software, version 9.1 (SAS Institute Inc, Cary, NC).
RESULTS
Baseline Characteristics
Out of 139 patients asked to participate in the study, 107 patients provided informed consent. Seven patients were excluded because of the occurrence of an ACS during follow-up. The analysis was therefore performed on a sample of 100 stable hemodialysis patients. Table 1 presents the baseline characteristics of our population. As expected, this is a high-risk population based on the prevalence of major risk factors for cardiovascular disease. In this population, 34 patients had diabetes and 37 patients had evidence of stable CAD. The etiology of ESRD is also shown in Table 1. Twenty-seven patients had more than 1 cause to their ESRD.
Characteristics of Patients at Enrolment
| n=100 | |
|---|---|
| Age, in years, mean (SD) | 58.5 (15.5) |
| Female, % | 44 |
| Weight, in Kg, mean (SD) | 68.9 (19.1) |
| Time on hemodialysis, in years, mean (SD) | 5.2 (6.0) |
| Hypertension, % | 93 |
| Tobacco use (past and present), % | 67 |
| Dyslipidemia, % | 65 |
| Left ventricular hypertrophy, % | 52 |
| CAD, % | 37 |
| Diabetes mellitus, % | 34 |
| Left ventricular ejection fraction, in %, mean (SD) | 58.3 (14.1) |
| Peripheral artery disease, % | 29 |
| Cardiac dysrhythmia, % | 22 |
| Previous stroke or TIA, % | 20 |
| Valvular heart disease, % | 20 |
| NYHA functional class 3-4, % | 7 |
| Hemoglobin < 90 g/L, % | 4 |
| Etiology of ESRD* | |
| Diabetes mellitus, % | 25 |
| Renal transplant failure, % | 20 |
| Primary glomerulonephritis, % | 18 |
| Nephrosclerosis, % | 12 |
| Congenital kidney disease, % | 10 |
| Secondary glomerulonephritis, % | 8 |
| Hypertension, % | 5 |
| Chronic pyelonephritis, % | 3 |
| Unknown, % | 6 |
| Other kidney disease, % | 20 |
CAD = Coronary artery disease; NYHA = New York Heart Association; SD = Standard deviation; TIA = Transient ischemic attack; ESRD=end-stage renal disease.
* Some patients had more than one etiology for their ESRD.
Comparison of Mean Serum cTnT Levels Before and After Hemodialysis; Complete Cohort, and Stratified by CAD and Diabetes Status
| Enrolment | 6 Months | 12 Months | ||||||||
|---|---|---|---|---|---|---|---|---|---|---|
| Before | After | p* | Before | After | p* | Before | After | p* | ||
| Complete Cohort | n | 98 | 95 | 89 | 90 | 80 | 75 | |||
| 0.06 (0.12) | 0.06 (0.08) | 0.43 | 0.05 (0.06) | 0.05 (0.06) | 0.50 | 0.07 (0.07) | 0.07 (0.08) | 0.67 | ||
| CAD | n | 36 | 34 | 30 | 30 | 27 | 26 | |||
| 0.10 (0.17) | 0.08 (0.09) | 0.25 | 0.08 (0.06) | 0.08 (0.08) | 0.89 | 0.10 (0.07) | 0.10 (0.08) | 0.41 | ||
| No CAD | n | 62 | 61 | 59 | 60 | 53 | 49 | |||
| 0.04 (0.06) | 0.04 (0.07) | 0.29 | 0.04 (0.06) | 0.04 (0.05) | 0.30 | 0.06 (0.07) | 0.06 (0.08) | 0.92 | ||
| Diabetes | n | 33 | 32 | 30 | 30 | 30 | 29 | |||
| 0.09 (0.17) | 0.06 (0.08) | 0.17 | 0.06 (0.06) | 0.05 (0.06) | 0.13 | 0.09 (0.08) | 0.08 (0.10) | 0.44 | ||
| No diabetes | n | 59 | 57 | 53 | 54 | 46 | 42 | |||
| 0.05 (0.07) | 0.05 (0.08) | 0.11 | 0.05 (0.07) | 0.05 (0.07) | 0.73 | 0.06 (0.07) | 0.06 (0.07) | 0.74 | ||
CAD=Coronary artery disease;
* p for comparison of mean cTnT before and after hemodialysis. Values for cTnT are mean (SD), in mcg/L unless specified.
Summary of Studies that Reported Pre- and Post-Dialysis cTnT Values
| Studies | Generation of Assay | n | Difference Between Pre- and Post-Dialysis cTnT |
|---|---|---|---|
| Frankel et al. 1996 [28] | 1 | 85 | No difference |
| Collinson et al. 1998 [29] | 1 & 2 | 198 | No difference |
| Wayand et al. 2000 [10] | 2 | 59 | Rise post-dialysis (p < 0.0001) |
| Ooi et al. 1998 [22] | 2 | 174 | Mean post-dialysis rise = 0.136 mg/L |
| Willging et al. 1998 [25] | 2 | 85 | Non-significant rise in post-dialysis concentration |
| Mockel et al. 1999 [30] | 2 | 40 | 0.010 mcg/L rise post-dialysis |
| Conway et al. 2005 [21] | 3 | 75 | 0.006 mcg/L rise post-dialysis after correction for hemoconcentration |
| Peetz et al. 2003 [31] | 3 | 104 | No difference |
| Deléaval et al. 2006 [20] | 3 | 50 | Non-significant decrease in mean cTnT of 0.017 mcg/L post-dialysis |
| Our study | 3 | 100 | No difference |
Mean Serum cTnT Levels
A total of 267 pre-dialysis and 260 post-dialysis cTnT measurements were done. Mean serum cTnT was elevated in these ESRD patients. This was observed in the complete cohort and in either subgroups with or without CAD or diabetes (Table 2). In the complete cohort, mean cTnT (0.06 mcg/L, both pre- and post-dialysis) was close to the threshold value for the diagnosis of myocardial necrosis (0.07 mcg/L at our institution). Serum cTnT was evenly distributed between the 3 diagnostic categories: below the detection limit of the assay (< 0.01 mcg/L), non-diagnostic elevation (0.01-0.06 mcg/L) and above threshold for myocardial necrosis (≥ 0.07 mcg/L) (Fig. 1a). Pre- and post-dialysis data were strikingly similar. About 30% of measured cTnT levels were above threshold for necrosis, both pre- and post-dialysis. Among these elevated cTnT levels, very few were very high, the majority being just above 0.07 mcg/L and below 0.25 mcg/L (Fig. 1b).
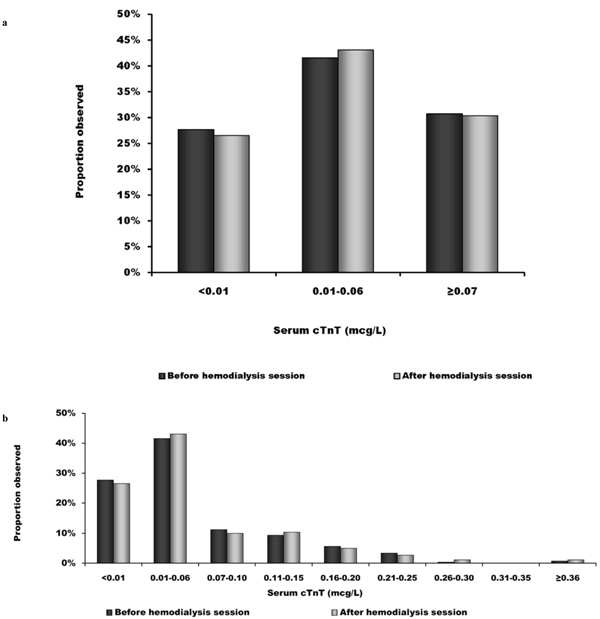
Distribution of serum cTnT. a) Distribution of serum cTnT before and after hemodialysis sessions according to diagnostic category: below the detection limit of the assay (< 0.01 mcg/L), non diagnostic elevation (0.01-0.06 mcg/L) and above necrosis threshold (≥ 0.07 mcg/L); b) Breakdown of the distribution of cTnT levels before and after dialysis in 0.05 mcg/L strata, showing that elevated values remain close to the necrosis threshold (0.07 mcg/L).
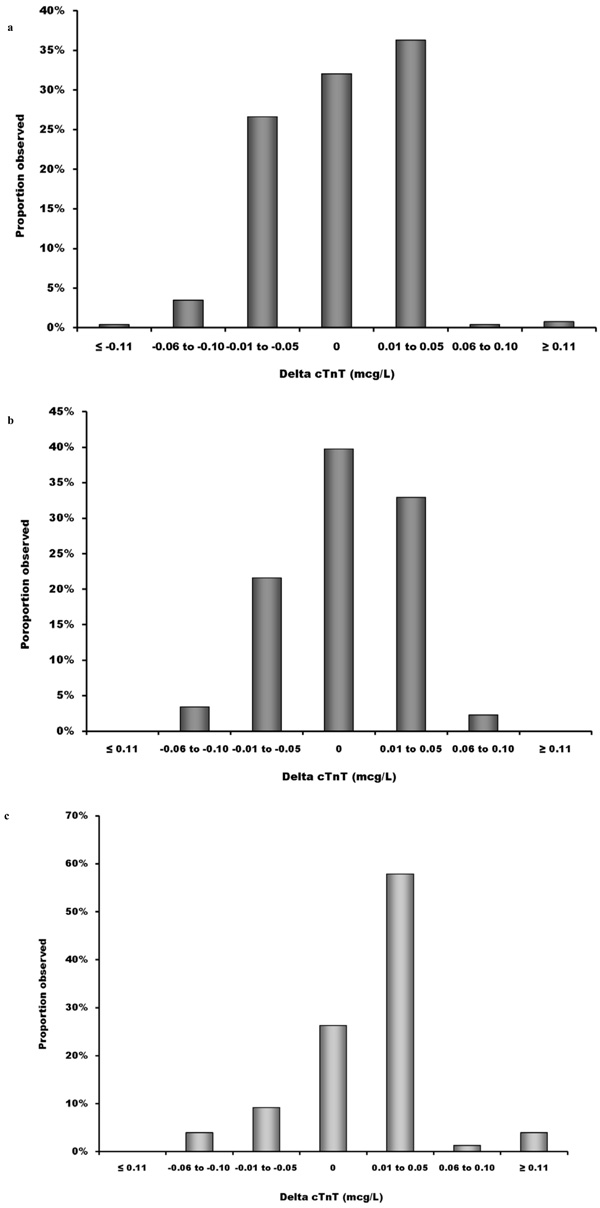
Effect of individual hemodialysis sessions and of time on serum cTnT. a) Change in serum cTnT levels after an individual hemodialysis session; b) Difference in pre-dialysis serum cTnT between enrolment and 6-month follow-up in individual patients; c) Difference in pre-dialysis serum cTnT between 6- and 12-month follow-up in individual patients.

Effect of coronary artery disease and diabetes mellitus on serum cTnT. a) Mean serum cTnT levels before and after hemodialysis sessions in patients with and without chronic coronary artery disease (CAD); b) Mean serum cTnT levels before and after hemodialysis sessions in patients with and without diabetes mellitus. *p < 0.05 for the comparison of mean cTnT in CAD vs. non-CAD patients and in diabetic vs. non-diabetic patients, respectively.
Effect of Hemodialysis Sessions on Serum cTnT
Among 259 samples with cTnT measured both before and after dialysis, 79 (30.5%) showed a decrease in serum cTnT, 97 (37.5%) showed an increase and 83 (32%) showed no change following dialysis (Fig. 2a), suggesting random variation.
Serum cTnT Levels Over Time During the 1-Year Follow-up
To determine whether cTnT levels change over time in an individual patient, we calculated the difference between two serum cTnT levels that were sampled 6 months apart in individual patients. Follow-up was complete in 78 patients. This reduction in the sample size was caused by 8 deaths, 3 transfers to another dialysis center, 3 renal transplants, 7 missing cTnT measurements and 1 voluntary withdrawal. Since we could not show a difference between pre- and post-dialysis values, we used pre-dialysis serum levels for this analysis. The first 6-month period is shown in Fig. (2b). The magnitude of the serum cTnT 6-month delta was small, as it was below ± 0.05 mcg/L in the majority of patients. Fig. (2b) also shows a near normal distribution of cTnT deltas. We present the same serum cTnT deltas for the second 6-month period of our study in Fig. (2c). Of note, in this last 6-month period, there were more patients showing a small rise in cTnT. Overall, it appears that the expected variation of serum cTnT over a 1-year period in individual hemodialysis patients is within ± 0.05 mcg/L.
Effects of CAD and Diabetes on Serum cTnT
Of 100 patients, 37 had chronic CAD. Fig. (3a) displays that, in stable patients with CAD, the mean cTnT were significantly higher than in patients without CAD. This is observed for most cTnT measurements, except for the post-dialysis cTnT at baseline. In our cohort, there were 34 diabetic patients. Mean serum cTnT levels were not significantly higher in these patients (Fig. 3b).
DISCUSSION
Elevated cTnT in Chronic Kidney Disease
One third of the measured cTnT levels were above 0.07 mcg/L. Myocardial cell damage and consequent leakage of troponin into the plasma compartment can occur after many cellular injuries [11]. The relatively low levels of cTnT measured in patients with ESRD suggest that minor cell injury has occurred, with release of small quantities of the cytoplasmic form of cTnT. The evidence that reduced clearance of troponins by the failing kidney fully accounts for their elevated levels is limited [14]. It has been proposed that reduced clearance of cTnT fragments partly account for the elevated levels detected by laboratory assays [15]. However, troponin levels do not seem to normalize with improved renal function after renal transplant [16]. The exact nature of the mechanism involved in myocyte injury and impaired excretion of cTnT remains to be better defined [14]. Only a few studies reported the proportion of hemodialysis patients with cTnT levels above threshold for the diagnosis of MI. There is significant variability in previously reported numbers, ranging from 18.6 to 46% of patients with levels above threshold in studies that use a third generation assay [8, 12, 17-20]. The use of different thresholds for necrosis may partly explain this wide range of values. Higher cTnT is associated with CAD but not with diabetes mellitus in our population. These results are similar to those from Conway et al., whose study design was similar to ours [21]. On the contrary, Iliou et al. found a strong association between high cTnT levels and diabetes mellitus [12]. Our results do show a tendency to higher cTnT levels in diabetics (Fig. 3b). Controversy remains since diabetes mellitus, has been incriminated as a cause of elevated cTnT in CKD [22, 23]. This could be caused by the accumulation of advanced glycation end-products in diabetic patients with ESRD [9].
Effect of Hemodialysis Sessions
Individual hemodialysis sessions did not have any substantial impact on serum cTnT levels in our population. To date, the few studies that used a third generation assay to measure cTnT did not find a difference between pre- and post-dialysis values, suggesting that cTnT is not filtered out of the plasmatic volume (Table 3). With 259 pairs of pre- and post-dialysis cTnT measurements in 100 patients, our study is the largest among those that used a third generation assay to demonstrate the stability of cTnT with dialysis sessions. The number of patients whose cTnT variation with individual hemodialysis sessions was above ± 0.05 mcg/L was small (9 patients). All of these patients were either diabetic or hypertensive, had left ventricular hypertrophy or had sustained hypotension during a hemodialysis session close to sampling of cTnT (data not shown). In CKD patients, Han et al. [24] found that extreme variations in cTnT (≥ 0.10 mcg/L) within a single hospital visit are predictive of short- and long-term cardiovascular events.
Effect of Time
With complete follow-up to 1 year in 78 patients, our study is by far the largest to confirm that serum cTnT levels only present minor variations during a 1-year follow-up. Han et al. found that mean cTnT levels were higher when CKD patients where admitted for a cardiovascular event compared with their baseline levels [24]. Given that our objective was to predict the course of cTnT levels in stable ESRD patients, we excluded these patients. A baseline cTnT value would only be valid if one can be certain that it is not subject to strong variations over time. We believe our study provides such reassurance regarding the stability of baseline cTnT values in ESRD patients. Our data therefore support the relevance of obtaining baseline cTnT values in CKD patients. Conway et al. showed that, in hemodialysis patients, cTnT started to rise between 8 and 15 months of follow-up. The rise exceeded 25% in half of the patients [21]. This is similar to our finding that more patients presented a small increase in serum cTnT during the second half of our study (Fig. 2c). Willging et al. noted that a longer history of dialysis was associated with a higher cTnT level [25]. We found that extreme (> 0.05 mcg/L) variations in cTnT over 6-month periods were rare (9 patients). These patients either had diabetes, hypertension, or documented CAD, or were hypotensive during hemodialysis (data not shown).
Clinical Implications
Our findings have several clinical implications. The possibility of a false positive diagnosis of myocardial infarction based on cTnT levels is a vexing situation for the clinician. Our data provide grounds for a clinical approach to elevated cTnT in ESRD patients based on knowledge of their baseline values. First, very high cTnT levels are rare in hemodialysis patients, with most values being far below 0.25 mcg/L. Thus, caution is required before imputing to the CKD cTnT values that are above this threshold. Second, although its usefulness was not tested in our cohort, cTnT values could be obtained at 1 point in time in hemodialysis patients to allow for future comparison. The importance of baseline cTnT values was shown in the setting of percutaneous coronary intervention [26]. We have demonstrated the stability of cTnT values in stable ESRD patients without ACS, which ensures the validity of a baseline value. Our data also show that cTnT can be sampled at any time with respect to hemodialysis. Since we have documented the stability of cTnT in a time frame of 12 months, consideration could be given to repeating baseline cTnT annually. Baseline cTnT may be particularly useful in patients with known CAD, in who elevated baseline cTnT values are more likely to be measured.
Strengths and Limitations
Notable advantages of our study are its prospective design and the fact that we have the largest cohort to date in which we were able to measure pre- and post-dialysis cTnT with a third generation assay and to follow them over time. However, our study is limited by the fact that we may have missed a late rise in cTnT by sampling immediately after hemodialysis, since a rise in cTnT can occur up to 8 h after an index event. It was obviously not feasible to ask the patients to stay for hours after their hemodialysis session. However, if such a rise occurs frequently, we believe some of the pre-dialysis samples would have reflected it. Yet, these values were stable over time. We also did not adjust cTnT levels for hemoconcentration following dialysis and for Kt/V. Kt/V is the clearance of urea, normalized to its estimated volume of distribution, which measures the adequacy of dialysis [27]. A lack of adjustment for hemoconcentration would cause a false elevation of serum cTnT following dialysis, which was not observed in our data. Our study is also limited by a reduction of sample size during follow-up due to missing cTnT samples at 1 or more of the pre-specified sampling time or due to patient deaths or transfers. It is also limited to a 1 year follow-up; a longer observation could have highlighted longer-term rise in serum troponin, as previously documented by others [21]. Finally, there is a possibility that the 32 hemodialysis patients who declined participation were significantly different from the rest of the study population.
CONCLUSIONS
cTnT levels were not affected by individual hemodialysis sessions, and remained stable around 0.06 mcg/L over a 1-year follow-up period in this stable ESRD population. However, random cTnT levels were higher in stable CAD patients undergoing hemodialysis.
FUNDING
Roche Diagnostics provided the laboratory assays for measurements of cTnT. Dr Stéphane Rinfret is a junior physician-scientist of the Fonds de la recherche en santé du Québec.
DISCLOSURE
None of the authors have conflicts to disclose.