All published articles of this journal are available on ScienceDirect.

Diastolic Dysfunction Criteria and Heart failure Readmission in Patients with Heart Failure and Reduced Ejection Fraction
Abstract
Background:
Advanced diastolic dysfunction (DDys) correlates with elevated LV filling pressures and predicts heart failure readmission (HF-R). As grade 2-3 DDys has predictive value for HF-R, and requires 2 of 3 criteria (left atrial volume index >34 ml/m2, E/e’>14, or tricuspid regurgitation velocity >2.8 m/s), we hypothesized that all 3 criteria would predict greater HF risk than any 2 criteria.
Methods:
In this single-center retrospective study that included 380 patients in sinus rhythm with HF and reduced ejection, we recorded patient characteristics, Doppler-echo, and HF-R with follow-up to 2167 days (median=1423 days; interquartile range=992-1821 days).
Results:
For grade 1 DDys (223 patients), any single criteria resulted in greater HF-R as compared to 0 criteria (HR=2.52, (1.56-3.88) p<0.0001) with an AUC (area under curve)=0.637, p<0.001. For grade 2 DDys (94 patients), there was greater HF-R for all 3 (vs. 0 criteria: HR=4.0 (2.90-8.36), p<0.0001). There was greater HF-R for 3 vs any 2 criteria (HR=1.81, (1.10-3.39), p=0.0222). For all 3 criteria, there was moderate predictability for HF-R (AUC=0.706, p<0.0001) which was more predictive than any 2 criteria (AUC difference 0.057, (0.011-0.10), p=0.009). For grade 3 DDys (63 patients), E/A>2+2-3 criteria identified a subgroup with the greatest risk of HF-R (HR=5.03 (4.62-22.72), p<0.0001) compared with 0 DDys criteria with moderate predictability for 2-3 criteria (AUC=0.726, p<0.0001) exceeding E/A>2+0-1 criteria (AUC difference=0.120, (0.061-0.182), p<0.001).
Conclusion:
Increasing the number of abnormal criteria increased the risk and predictive value of HF-R for grade 1-3 DDys in patients with HF with reduced ejection fraction.
1. INTRODUCTION
The 2016 Diastolic Function (DF) Guidelines have superseded the 2009 guidelines [1, 2] for the description of DF and estimation of left ventricular (LV) filling pressures. There were limited outcome studies associated with the most recent guidelines. Subsequently, there have been several studies supporting the predictability of these guidelines for predicting higher LV filling pressures and adverse events with increasing grades of diastolic dysfunction (DDys) [3-5]. We recently reported that heart failure readmission (HF-R) was increased in grade 2-3 DDys compared with grade 1 in heart failure (HF) in patients with preserved ejection fraction, mid-range ejection fraction, and reduced ejection fraction [6]. However, the predictive value ranged from low to moderate being most predictive in patients with HF with reduced ejection fraction.
Accordingly, the purpose of this study was to determine whether a greater number of criteria or any specific combination of criteria used to establish grade 2 DDys) are more predictive for HF-R. Furthermore, we determined whether any specific criterion or combination of criteria was more predictive for grade 3 DDys. We also addressed whether any specific criterion was more predictive for HF-R for grade 1 DDys. We utilized an HF database generated from a non-urban based university in which patients had acceptable Doppler-echocardiography and had reduced ejection fractions and significant follow-up for HF-R.
2. MATERIALS AND METHODS
This study received expedited approval from the Quillen College of Medicine Institutional Review Board. The clinical electronic medical record (Allscripts, Touchworks, Chicago, IL) was queried for HF diagnosis using ICD-9 codes (428.xx). From the electronic medical record, only those patients with HF and followed for >30 days and acceptable Doppler echocardiograms with an LV ejection fraction <50% were initially included. There were 620 identified patients with HF with >30 days of follow-up. Patients with atrial fibrillation (92 patients), <30 days of outpatient follow-up or without adequate Doppler-echocardiograms which required the evaluation of E/A (peak mitral rapid filling velocity/peak mitral atrial filling velocity), tricuspid regurgitation velocity (TR-V), E/e’ (E/peak mitral annular early diastolic velocity), or left atrial volume index (LAVI) (132 patients), with congenital heart disease (4 patients), and greater than mild aortic or mitral valve disease (stenosis or regurgitation-12 patients) were excluded. Consequently, 380 patients were evaluated in and followed for 30 days up to October 1, 2016 (median=1459 days and maximum of 2167 days). Previous studies by our group have reported the results of some of these patients [6-9]. In this study, 244 of the 380 patients were previously reported with 136 patients not previously reported.
Age, sex, prevalence of coronary disease, myocardial infarction, diabetes, and hypertension were obtained from medical records. Medications were reviewed and recorded at each visit. Height, weight, blood pressure, and heart rate were recorded at the time of the echocardiogram. The coronary disease was defined as having either >50% lesion in any coronary artery by coronary angiography, abnormal myocardial perfusion scan, or evidence of a myocardial infarction using the universal definition [10, 11]. Diabetes was defined as taking anti-diabetic medications, a fasting glucose >126 mg/dl, or hemoglobin A1C >6.5%. Hypertension was defined as taking anti-hypertensive medications or a blood pressure >140/90. Hyperlipidemia was defined taking lipid lowering medications or total cholesterol >200 mg/dl. The mean or median levels of brain natriuretic peptide (BNP), hemoglobin and creatinine were obtained from laboratory data.
The diagnosis of HF was verified by using the universal definition of HF [12]. Inpatient and outpatient records were examined to determine if patients’ hospital admission was due to HF. All-cause mortality was determined from medical records (85.5%), conversation with family (5.5%), and examining obituaries (2.5%) and the national death index (6.5%). We were unable to determine cardiovascular mortality on all patients including HF mortality. HF-R was determined from the date 1st seen to the time of HF-R. Data were censored in patients whom HF-R (4 patients) or all-cause mortality (5 patients) could not be determined at the time of last patient contact.
2.1. Echocardiography
Doppler echocardiography was obtained within 1 week of the time of HF diagnosis. Similar to our previous studies [6-9], we digitally obtained cine clips from 3-5 consecutive cardiac cycles using a Phillips iE 33 (Cleveland, Ohio) with a 2.5 mHz broadband transducer (X5) at held-end expiration from multiple ultrasonic windows to provide views of all cardiac chambers and valves. Transmitral pulsed Doppler was obtained from 1-2 x-1-2 mm sample volume placed at the tips of the mitral leaflets. Spectral tissue Doppler was obtained from the septal and lateral mitral annuli using a 5x5 mm pulsed Doppler sample volume.
2.2. Calculated Echocardiographic Parameters
As in our previous studies [6-9], all measurements were performed by the investigators using the average of 3 consecutive cardiac cycles at held-end expiration, according to the recommendation of the American Society Echocardiography (ASE) guidelines [13]. We calculated biplane LV end-diastolic and end-systolic volumes (using Simpson’s rule), LV mass, and left atrial volume and indexed these measures to body surface area. The ejection fraction was calculated as (end-diastolic volume-end systolic volume)/end-diastolic volume. Right ventricular (RV) end-diastolic area and tricuspid annular systolic plane excursion (TAPSE) was measured as described by the ASE guidelines [13].
From transmitral Doppler, peak rapid filling mitral velocity (E), peak atrial filling velocity (A), and E/A were obtained based on ASE Guidelines [1, 2] and required clear separation of the E and A velocity spectra. Spectral Doppler of the septal and lateral mitral annulus was analyzed for the peak rapid lengthening velocity (e’) and averaged. The E/e’ was calculated. Using a continuous wave Doppler transducer, tricuspid regurgitation (TR) velocity was obtained from multiple windows. RV systolic pressure was estimated using the modified Bernoulli equation with the addition of a right atrial pressure estimate based on respiratory variations of the inferior caval dimension [2].
Using the 2016 ASE Guidelines, DDys grading was performed assuming all patients had at least grade 1 DDys due to the HF diagnosis [2]. Patients were characterized as grade 1, grade 2, or grade 3 based on the ASE criteria [2]. With regard to indeterminate diastolic function grade, we excluded these patients from the patient cohort by ensuring that all 3 criteria were available to evaluate and there was no merging of the E and A velocities. On the basis of LAVI >34 ml/m2, TR velocity >2.8 m/s, or E/e’ >14, grade 1 diastolic DDys was divided into 0 criteria or any 1 of the above criteria. Similarly, for grade 2 diastolic DDys, we divided patients into those any of the above 2 criteria or all 3 criteria. For grade 3 DDys, as all patients had E/A >2, patients were divided into those with 0-1 criteria or 2-3 criteria.
2.3. Statistics
Data were expressed as mean ± standard deviation for continuous normally distributed data as determined by Kolmogorov-Smirnov test. No imputations were used for missing data. For data that were not normally distributed, median and interquartile ranges were computed. Categorical data were expressed as a percentage of the group having that attribute. Differences between groups were determined using 1-way analysis of variance or 1-way analysis of variance on ranks. If the F value was <0.05, the differences between individual groups were determined by Dunn’s test. Differences in percentages among groups were determined using chi-square. If the p<0.05, then a multi-comparison technique was utilized to determine where the significant differences existed. (COMPROP-SAS, Cary, NC, USA). A 2-sided p<0.05 were considered significant. For all DF grades, univariate and multivariate logistic regression using was performed to determine the independent predictors of HF-R. Collinearity was assessed by the variance inflation factor. For those correlates with variance inflation factors >2.5, only the strongest predictor was included. Univariate and multivariate Cox proportional analysis was utilized to assess the effect of DF grades of HF-R included. Kaplan-Meier curves were constructed for HF-R for each independent multivariate correlate. Log-rank testing was then performed to determine significance. Adjusted hazard ratios and confidence intervals were calculated. Similarly, univariate and multivariate Cox proportional analysis was utilized to assess the effect of an increasing number of DDys criteria for HF-R for each DF grade. Adjusted Kaplan-Meier curves were constructed to determine the effect of increasing DDys criteria on HF-R for each DF grade. Receiver operating characteristics (ROC) curves were constructed to determine whether the increasing number of DDys criteria for each DF grade improved predictability for HF-R using the area under the curve (AUC) statistic. Statistics were performed using Sigma Stat 4 (SYSTAT, San Jose, CA, USA), XLSTAT (Addinsoft, Long Island, NY, USA) and SAS (Cary, NC, USA).
3. RESULTS
Table 1 summarizes the results from clinical, Doppler-echocardiographic and outcome measures for grade 1, 2, and 3 DDys. Grade 2 DDys patients had a greater prevalence of mitral regurgitation, digoxin use, greater BNP levels and increased HF-R (51.1 vs 34.5%, p<0.05). LV mass index was increased and RV systolic function was reduced as characterized by TAPSE. Grade 3 DDys patients were older, and had a greater prevalence of mitral regurgitation, beta-blocker use, angiotensin-converting enzyme inhibitor/angiotensin receptor blocker and greater digoxin use. BNP (brain natriuretic peptide) and creatinine were increased. There was increased LV mass index, greater E, lower TAPSE, and greater all-cause mortality and HF-R (65.0 vs 34.5%, p<0.001). When comparing grade 3 vs grade 2 DDys, there was a greater prevalence of MR, higher E, and greater incidence of HF-R (65.0 vs 51.1%, p<0.05) LAVI, E/e’, and TR velocity were further increased over the values for grade 2 DDys. Multivariate logistic regression revealed that E/A>2 (OR=2.11 (1.15-3.86), p=0.016), E/e’>14 (OR=1.83 (1.12-3.01), p=0.016), and LAVI >34 ml/m2 (OR=1.84 (1.01-2.75), p=0.046) were predictors of HF-R but not RV function as assessed by TAPSE.
| - | Grade 1 (n=223) | Grade 2 (n=94) | Grade 3 (n=63) |
|---|---|---|---|
| Age (years) | 72±14 | 75±11 | 79±11*** |
| Sex (M/F) | 115/108 | 50/44 | 35/28 |
| Coronary Disease (%) | 38.6 | 41.5 | 34.9 |
| Myocardial Infarction (%) | 28.6 | 29.9 | 28.6 |
| Diabetes Mellitus (%) | 46.5 | 51.3 | 49.3 |
| Hypertension (%) | 84.7 | 90.4 | 88.7 |
| Hyperlipidemia (%) | 70.4 | 82.1 | 75.5 |
| Mitral Regurgitation (%) | 24.6 | 37.3* | 49.7***^ |
| Tricuspid Regurgitation (%) | 31.0 | 32.0 | 43.1* |
| ACEI/ARB (%) | 50.6 | 62.1 | 69.8* |
| Beta-Blockers (%) | 65.5 | 72.3 | 82.5* |
| Aldosterone Blocker (%) | 15.7 | 9.6 | 15.9 |
| Nitrates (%) | 9.4 | 6.1 | 11.1 |
| Hydralazine (%) | 9.5 | 8.6 | 9.6 |
| Digoxin (%) | 10.3 | 22.3* | 19.0* |
| Systolic BP (mmHg) | 117.8+23.7 | 128.1+23.1 | 128.6+22.8 |
| Diastolic BP (mmHg) | 72.8+11.9 | 69.7+12.3 | 69.0+12.5 |
| Heart Rate (beats/min) | 77.0+15.1 | 73.5+10.9 | 76.5+14.4 |
| BSA (m2) | 1.80+0.17 | 1.78+0.15 | 1.76+0.16 |
| BNP (pg/ml) | 598 (365-1223) | 984 (498-2026)* | 1163 (527-2892)* |
| Hemoglobin (g/dl) | 12.2+1.9 | 11.9+1.9 | 11.5+1.9 |
| Creatinine (mg/dl) | 1.26+0.79 | 1.41+1.05 | 1.70+0.93** |
| EDVI (ml/m2) | 54.4+20.1 | 61.6+27.8* | 59.2+24.1 |
| ESVI (ml/m2) | 28.8+17.2 | 35.6+24.9* | 34.2+24.8 |
| Ejection Fraction (%) | 42.5+5.6 | 42.4+5.1 | 41.5+5.8 |
| LV Mass Index (g/m2) | 93.1+31.4 | 111.1+29.5*** | 107.0+25.6** |
| TAPSE (cm) | 15.7+34.9 | 13.3+5.6* | 11.5+4.5*** |
| RV Base (cm) | 3.6+0.7 | 3.9+0.8 | 3.9+0.9 |
| E (cm/s) | 94.4+34.8 | 113.3+33.3*** | 132.7+33.7***^^ |
| Deceleration Time (ms) | 221.6+77.2 | 217.3+71.1 | 206.9+65.1 |
| Stroke Volume Index (ml/m2) | 39.8+14.23 | 38.9+15.8 | 36.3+19.1 |
| Left Atrial Volume Index (ml/m2) | 25.2+10.1 | 41.5+16.6*** | 49.2+14.4***^^ |
| Tricuspid Velocity (m/s) | 2.63+0.545 | 3.07+0.53*** | 3.34+0.42***^^ |
| E/e’ | 11.5+4.3 | 16.5+6.7*** | 20.6+7.7***^^^ |
| E/A | 1.17+0.48 | 1.27+0.83 | 2.97+0.41***^^^ |
| Heart Failure Readmission (%) | 34.5 | 51.1** | 65.0***^ |
| All-cause Mortality (%) | 27.4 | 38.1 | 46.0** |
Statistics: *p<0.05, **p<0.01, p<0.001 vs grade 1; ^p<0.05, ^^p<0.01, grade 2 vs grade 3.
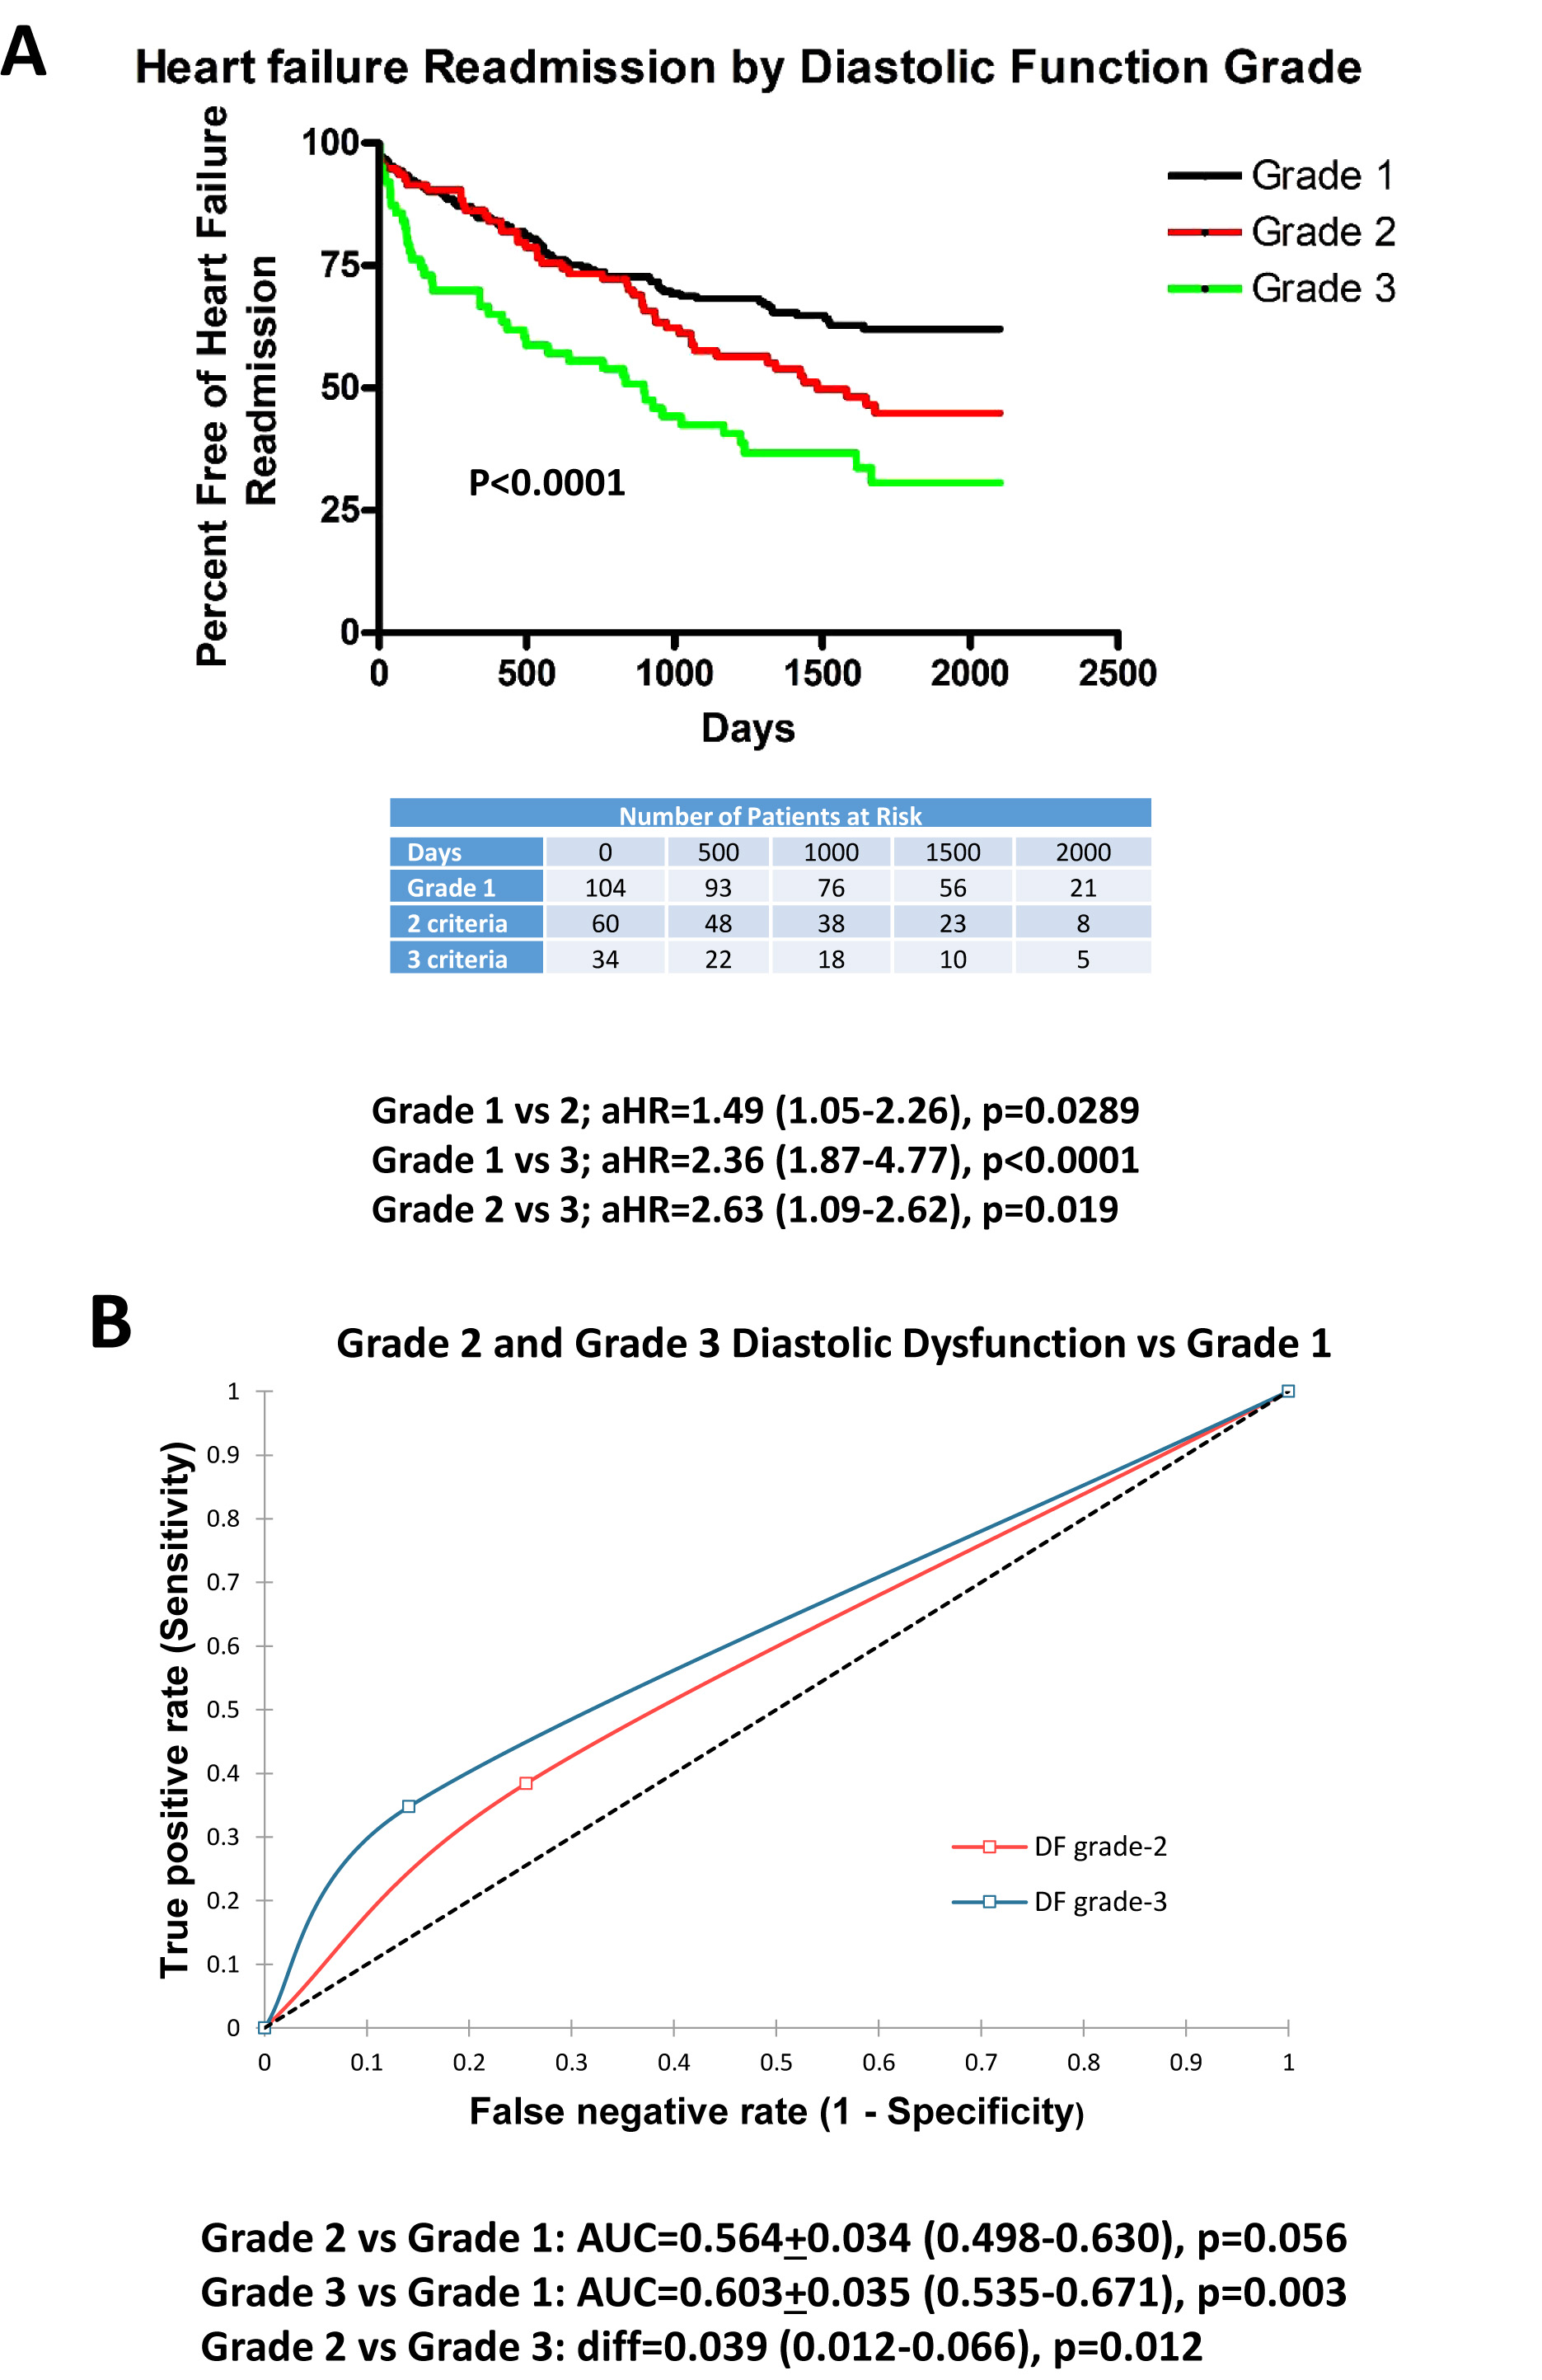
Fig. (1A) plots the adjusted Kaplan-Meier curves for grade 1, 2 and 3 DDys with regard to HF readmission. For each advancing grade of DDys, there was an increase in HF-R. Furthermore, grade 3 DDys were associated with greater HF readmission than grade 2. ROC curves (Fig. 1B) demonstrate that grade 2 and grade 3 DDys had greater predictability for HF readmission than grade 1 but with low predictability for grade 2 vs 1 (AUC=0.563, p=0.047) and low-moderate predictability for grade 3 (AUC=0.603, p=0.003). There was a significant improvement in predictability between grade 3 vs grade 2 (AUC difference=0.039, p=0.012).
Table 2 summarizes results from clinical, Doppler-echocardiographic and outcome measures for grade 1 DDys with 0 criteria (reduced ejection fraction <50% alone) and any single criteria (LAVI >34 ml/m2, E/e’>14, or TR-V >2.8 m/s). Patients with any single criterion were older, and had a greater prevalence of beta-blocker use, elevated creatinine, peak E velocities and HF-R (48.6 vs 24.0%, p<0.001). Multivariate logistic regression revealed that TR-V >2.8 m/s (OR=2.35 (1.01-5.08), p=0.029), creatinine (OR=1.55 (1.03-2.34), p=0.038), and LAVI>34 ml/m2 (OR=2.47 (1.03-5.89), p=0.042) were predictors of HF-R in patients with grade 1 DDys.
Fig. (2) demonstrates that patients with any single criterion of DDys had an increase in HF-R. Specifically for each criterion, there was a significantly adjusted hazard ratio for readmission. ROC curves demonstrate that any single criterion has greater predictability (low-moderate) than 0 criteria (AUC=0.637, p=0.001). Furthermore, each criterion also demonstrated greater predictability than 0 criteria (AUC=0.594-0.627).
| - | 0 Criteria (n=104) | 1 Criteria (n=119) |
|---|---|---|
| Age (years) | 69±15 | 75±12** |
| Sex (M/F) | 53/51 | 62/57 |
| Coronary Disease (%) | 59.8 | 68.2 |
| Myocardial Infarction (%) | 27.9 | 32.9 |
| Diabetes Mellitus (%) | 38.5 | 45.7 |
| Hypertension (%) | 86.5 | 91.6 |
| Hyperlipidemia (%) | 69.2 | 79.4 |
| Mitral Regurgitation (%) Tricuspid | 18.3 | 30.0 |
| Regurgitation (%) | 22.1 | 31.8 |
| ACEI/ARB (%) | 72.1 | 66.3 |
| Beta-Blockers (%) | 62.5 | 75.7* |
| Aldosterone Blocker (%) | 7.7 | 14.0 |
| Nitrates (%) | 5.8 | 14.0 |
| Hydralazine (%) | 2.9 | 5.6 |
| Digoxin (%) | 4.8 | 5.6 |
| Calcium Channel Blockers (%) | 24.0 | 25.2 |
| Systolic Blood Pressure (mmHg) | 125.8±23.0 | 129.7±24.3 |
| Diastolic Blood Pressure (mmHg) | 72.6±12.1 | 73.1±11.8 |
| Heart Rate (beats/min) | 78.9±15.2 | 75.1±14.6 |
| Body Surface Area (m2) | 1.80±0.15 | 1.80±0.16 |
| BNP (pg/l) | 543 (321-1591) | 642 (387-1325) |
| Hemoglobin (g/dl) | 12.5±1.8 | 11.8±1.9 |
| Creatinine (mg/dl) | 1.12+0.52 | 1.41±0.97* |
| LVEDVI (ml/m2) | 53.7±16.7 | 55.0±23.0 |
| LVESVI (ml/m2) | 27.1±14.5 | 30.3±19.5 |
| Ejection Fraction (%) | 42.8±4.5 | 42.3±6.1 |
| LV Mass Index (g/m2) | 88.5±28.5 | 97.2±35.2 |
| TAPSE (cm) | 16.5±4.6 | 15.0±5.0 |
| RV Base (cm) | 3.4±0.6 | 3.8±0.78 |
| Left Atrial Volume Index (ml/m2) | 20.6±6.1 | 29.2±11.1 |
| E (cm/s) | 86.1±28.5 | 101.5±38.2** |
| E/A | 1.02±0.51 | 1.33±0.85* |
| E/e’ | 9.9±2.3 | 12.7±5.0** |
| Stroke Volume Index (ml/m2) | 40.5±7.5 | 39.4±15.5 |
| Tricuspid Regurgitation velocity (m/s) | 2.34±0.39 | 2.80±0.55*** |
| Heart Failure Readmission (%) | 24.0 | 48.6*** |
| All-cause Mortality Rate (%) | 24.0 | 33.6 |
Statistics: *p<0.05, **p<0.01, ***p<0.001 vs 0 criteria.
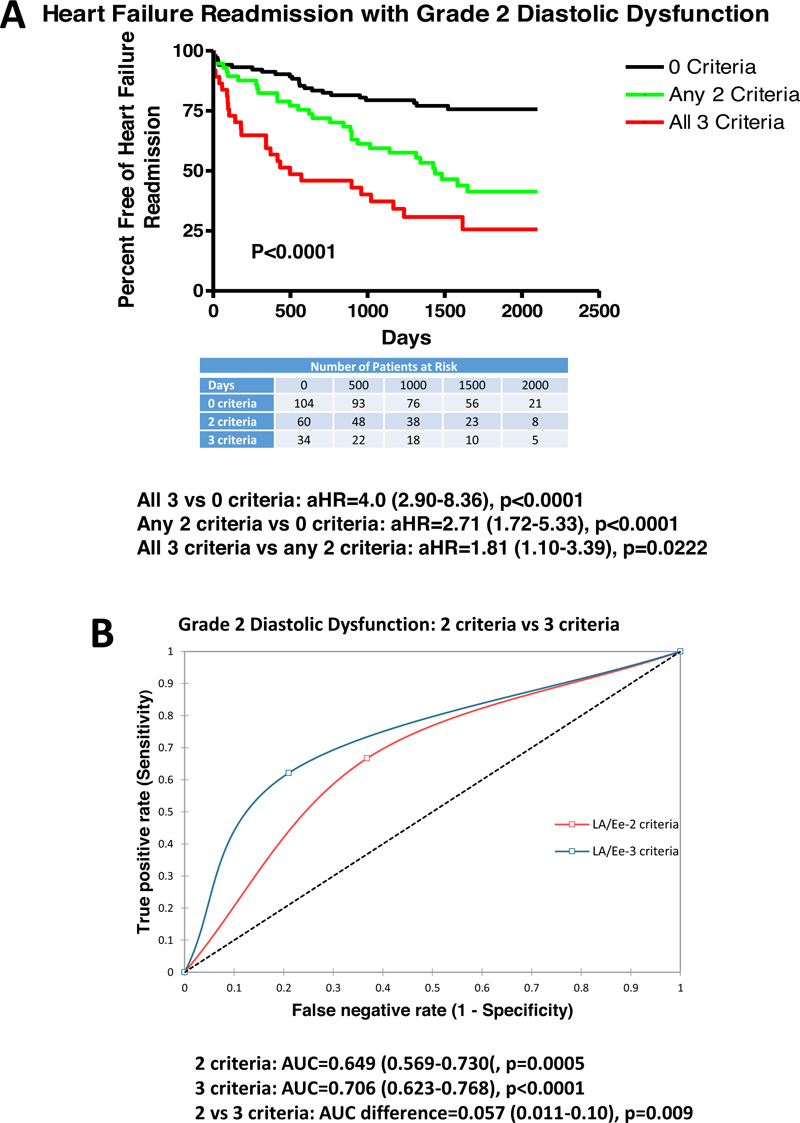
Table 3 summarizes results from clinical, Doppler-echocardiographic and outcome measures for grade 2 DDys with any 2 criteria or all 3 criteria as compared with patients with reduced LV ejection fraction (0 criteria). Patients with any 2 criteria were older, and had a greater prevalence of mitral regurgitation, greater digoxin use, reduced hemoglobin, greater LV mass index, reduced TAPSE, greater E velocity, and greater HF-R (45.0 vs 24.0%, p<0.05). Similarly, for grade 2 DDys and all 3 criteria, patients were older, had a greater prevalence of mitral and tricuspid regurgitation, greater digoxin use, greater BNP, greater creatinine, reduced hemoglobin, greater LV mass index, reduced TAPSE, greater E velocity, and increased HF-R (60.0 vs 24.0%, p<0.001) and all-cause mortality. Patients with all 3 criteria, as compared to any 2 criteria, had greater mitral and tricuspid regurgitation, greater E velocity, and increased HF-R (60.0 vs 45.0%, p<0.05). Using multivariate logistic regression, predictors of HF-R included E/e’ >14 (OR=6.99 (1.75-28.0), p=0.006) and LV mass index (OR=0.97 (0.95-0.99), p=0.006) but not TAPSE.
Fig. (3) demonstrates that patients with any 2 criteria (aHR=2.71 (1.72-5.33), p<0.0001) with aHR varying from 2.21-3.12 for varying combination of 2 criteria (LAVI >34 ml/m2, TR velocity >2.8 m/s, or E/e’>14) had increased HF-R vs 0 criteria (reduced ejection fraction). Additionally, all 3 criteria (aHR=4.0 (2.90-8.36), p<0.0001) had increased HF-R vs 0 criteria (reduced ejection fraction). Furthermore, all 3 criteria had greater HF-R compared with any 2 criteria (aHR=1.81 (1.10-3.39), p=0.0222 with aHR varying from 1.59-2.21 for varying combination of any 2 criteria). ROC curves demonstrate that any 2 criteria had low-moderate predictability for HF-R (AUC=0.649, p=0.0005) with AUC’s varying from 0.612-6.89 for all variations of 2 criteria. All 3 criteria demonstrated moderate predictability for HF-R (AUC=0.706, p<0.0001). All 3 criteria were more predictive than any 2 criteria (AUC difference=0.057, p=0.009) with a difference from 0.041-0.069 for varying combinations of 2 criteria.
| - | 0 Criteria (n=104) | 2 Criteria (n=60) | 3 Criteria (n=34) |
|---|---|---|---|
| Age (years) | 69±15 | 77±11*** | 82±10*** |
| Sex (M/F) | 53/51 | 32/28 | 18/16 |
| Coronary Disease (%) | 59.8 | 57.3 | 60.0 |
| Myocardial Infarction (%) | 27.9 | 28.0 | 24.4 |
| Diabetes Mellitus (%) | 38.5 | 52.0 | 51.1 |
| Hypertension (%) | 86.5 | 90.6 | 86.6 |
| Hyperlipidemia (%) | 69.2 | 81.3 | 64.7 |
| Mitral Regurgitation (%) | 18.3 | 34.6* | 57.7***^ |
| Tricuspid Regurgitation (%) | 22.1 | 30.6 | 46.6***^ |
| ACEI/ARB (%) | 72.1 | 72.0 | 58.5 |
| Beta-Blockers (%) | 62.5 | 72.0 | 80.0 |
| Aldosterone Blocker (%) | 7.7 | 67 | 1.1 |
| Nitrates (%) | 5.8 | 5.3 | 6.7 |
| Hydralazine (%) | 2.9 | 8.0 | 4.4 |
| Digoxin (%) | 4.8 | 24.0** | 17.7* |
| Systolic BP (mmHg) | 125.8±23.0 | 129.1±24.1 | 128.7±21.8 |
| Diastolic BP (mmHg) | 72.6±12.1 | 69.3±11.8 | 68.2±10.7 |
| Heart Rate (beats/min) | 78.9±15.2 | 75.9±10.7 | 78.6+14.7 |
| BSA (m2) | 1.80±0.15 | 1.77±0.16 | 1.75±0.16 |
| BNP (pg/ml) | 543 (321-1591) | 863 (604-1921) | 1119 (618-2914)* |
| Hemoglobin (g/dl) | 12.5±1.8 | 11.9±2.0* | 11.3±1.8*** |
| Creatinine (mg/dl) | 1.12±0.52 | 1.38±1.23 | 1.76±0.53** |
| EDVI (ml/m2) | 53.7±16.7 | 60.4±28.9 | 57.4±25.8 |
| ESVI (ml/m2) | 27.1±14.5 | 34.5±25.6 | 30.2±23.9 |
| Ejection Fraction (%) | 42.8±4.5 | 43.2±5.1 | 42.5±5.6 |
| LV Mass Index (g/m2) | 88.5±28.5 | 110.0±30.2*** | 105.0±27.0** |
| TAPSE (cm) | 16.5±4.6 | 13.6±6.0* | 12.0±4.5*** |
| RV base (cm) | 3.4±0.6 | 3.7±0.8 | 3.8±0.9 |
| E (cm/s) | 86.1±28.5 | 111.4±33.0*** | 141.6±34.1***^^^ |
| Stroke Volume Index (ml/m2) | 40.5±7.5 | 39.9±16.0 | 40.0±20.9 |
| Left Atrial Volume Index (ml/m2) | 20.6±6.1 | 42.1±17.1*** | 42.2±23.9*** |
| Tricuspid Velocity (m/s) | 2.34±0.39 | 3.11±0.32*** | 3.31±0.41***^ |
| E/e’ | 9.9±2.3 | 15.4±5.5*** | 20.1±7.2***^^^ |
| E/A | 1.02±0.51 | 1.15±0.40** | 1.26±0.31*** |
| Heart Failure Readmission (%) | 24.0 | 45.3* | 60.0***^ |
| All-Cause Mortality (%) | 24.0 | 36.0 | 48.8** |
Statistics: *p<0.05, **p<0.01, ***p<0.001 vs 0 criteria; ^p<0.05, ^^p<0.01, 2 vs 3 criteria.
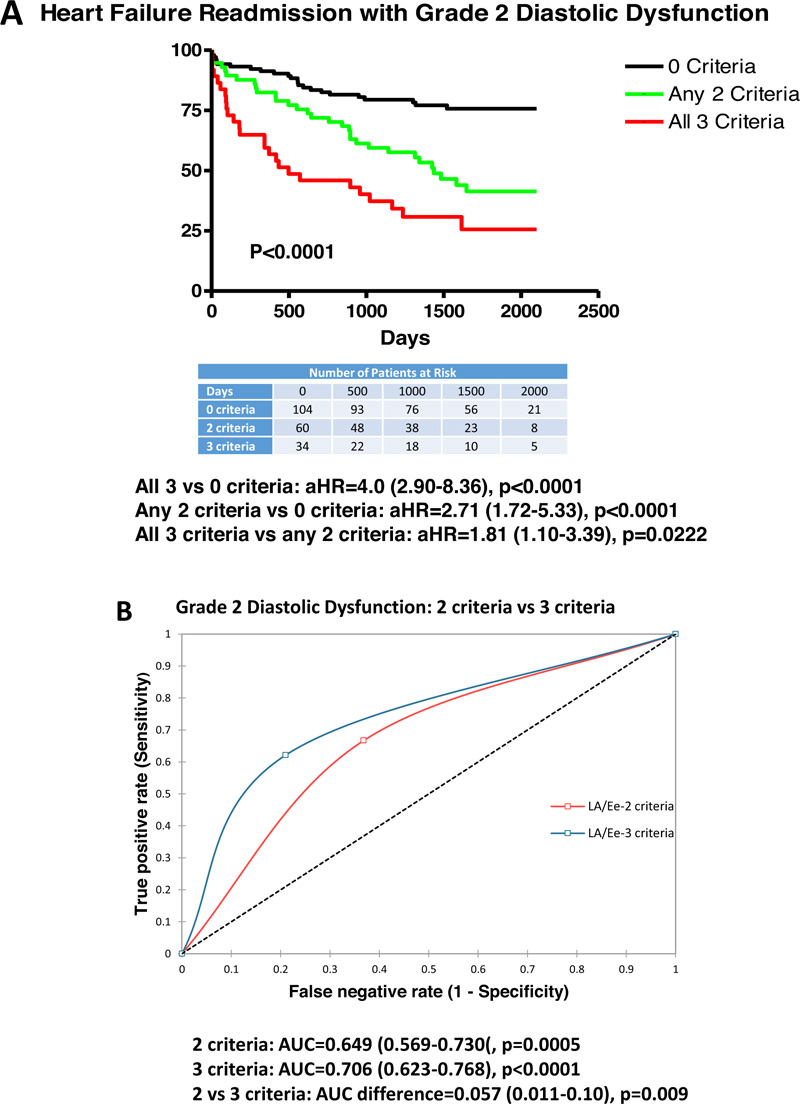
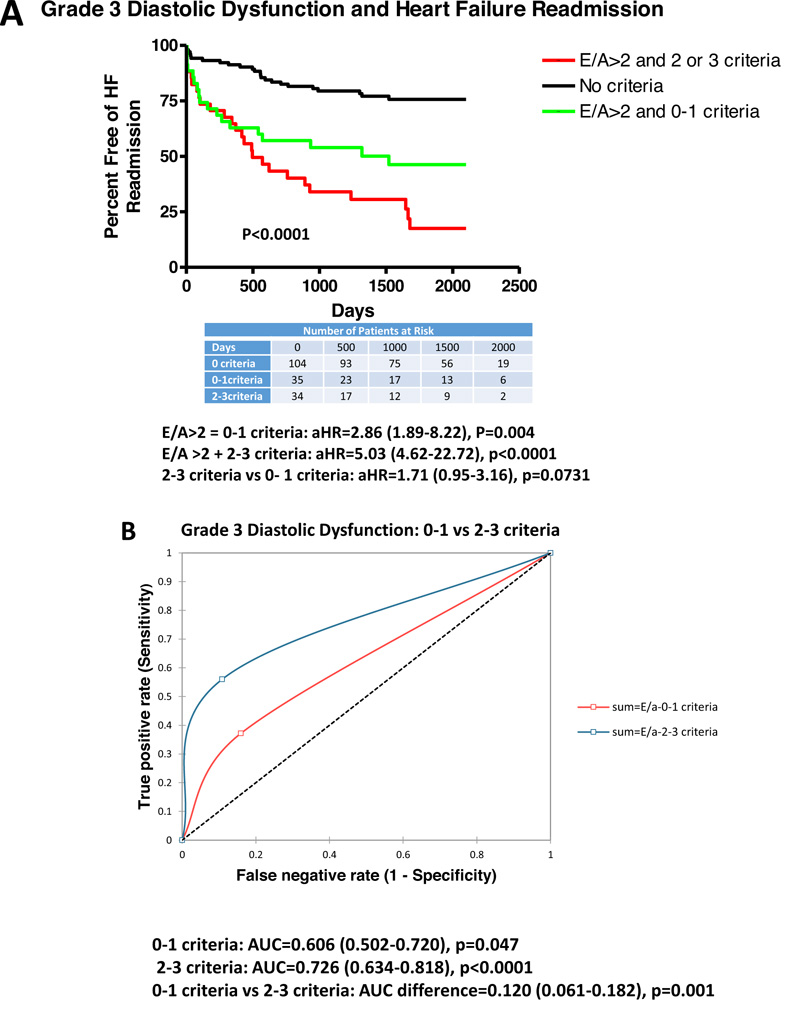
Table 4 summarizes results from clinical, Doppler-echocardiographic and outcome measures for grade 3 DDys with 0-1 criteria or 2-3 criteria as compared to patients with reduced LV ejection fraction (0 criteria). Patients with grade 3 DDys (all E/A >2) with 0-1 criteria were older, higher prevalence of mitral and tricuspid regurgitation, reduced TAPSE, lower stroke volume index, increased E velocity and greater HF-R (46.6 vs 24.0%, p<0.001) and all-cause mortality. Patients with grade 3 DDys with 2-3 criteria had a greater prevalence of mitral regurgitation, greater use of aldosterone antagonists and digoxin, higher BNP and creatinine, larger LV end diastolic volume index and LV mass index, reduced TAPSE, increased RV size, reduced stroke volume index, higher E velocity, and greater HF-R (75.6 vs 24.0%, p<0.001). When comparing patient with 2-3 criteria vs 0-1 criteria, patients had a greater prevalence of previous myocardial infarction, digoxin use, larger LV end-diastolic volume and LV mass index, greater RV size, and greater HF-R (75.6 vs 46.6%, p<0.05). Using multivariate logistic regression, HF-R could be predicted by TAPSE (OR=1.21 (1.02-1.43), p=0.033), BNP (OR=1.01 (1.00-1.02), p=0.047), and severity of DDys grading (grade 1 vs 2 vs 3; OR=1.81 (1.01-2.97), p=0.048).
Fig. (4) demonstrates adjusted Kaplan-Meier curves for patients with grade 3 DDys with 0-1 and 2-3 criteria vs 0 criteria (reduced LV ejection fraction alone). HF-R was increased in patients with E/A>2 and 0-1 criteria (HR=2.86 (1.89-8.22), p=0.004), and E/A >2 and 2-3 criteria (HR=5.03 (4.62-22.72), p<0.0001). There was a trend to greater HF-R comparing patients with 2-3 criteria vs 0-1 criteria (HR=1.71 (0.95-3.16), p=0.0731). There was mild-moderate predictability for E/A >2 and 0-1 criteria vs 0 criteria (AUC=0.606, p=0.047). There was moderate predictability for E/A and 2-3 criteria vs 0 criteria (AUC=0.726, p<0.0001). Additionally, there was a significant difference in predictability between E/A and 0-1 criteria vs E/A >2 and 2-3 criteria (AUC difference=0.12, p=0.001).
| - | 0 Criteria (n=104) | E/A >2 and 0-1 Criteria (n=26) | E/A >2 and 2-3 Criteria (n=37) |
|---|---|---|---|
| Age (years) | 69±15 | 78±14** | 73±12 |
| Sex (M/F) | 53/51 | 15/11 | 20/17 |
| Coronary Disease (%) | 59.8 | 57.6 | 65.3 |
| Myocardial Infarction (%) | 27.9 | 11.0 | 37.8^ |
| Diabetes Mellitus (%) | 38.5 | 50.0 | 56.8 |
| Hypertension (%) | 86.5 | 92.3 | 91.9 |
| Hyperlipidemia (%) | 69.2 | 76.9 | 81.1 |
| Mitral regurgitation (%) | 18.3 | 46.1* | 37.8* |
| Tricuspid Regurgitation (%) | 22.1 | 46.1* | 29.7 |
| ACEI/ARB (%) | 72.1 | 69.2 | 73.0 |
| Beta-Blockers (%) | 62.5 | 73.0 | 81.1 |
| Aldosterone blocker (%) | 7.7 | 7.6 | 24.3* |
| Nitrates (%) | 5.8 | 3.8 | 16.2 |
| Hydralazine (%) | 2.9 | 3.8 | 10.8 |
| Digoxin (%) | 5.2 | 0 | 18.9*^ |
| Systolic BP (mmHg) | 125.8±23.0 | 125.9±12.2 | 126.1±21.4 |
| Diastolic BP (mmHg) | 72.6+12.1 | 74.7±11.9 | 70.9±11.2 |
| Heart Rate (beats/min) | 78.9±15.2 | 76.1±13.8 | 73.6±12.1 |
| BSA (m2) | 1.80±0.15 | 1.72±0.15 | 1.78±0.15 |
| BNP (pg/ml) | 543 (321-1591) | 596 (424-1118) | 1289 (607-2844)* |
| Hemoglobin (g/dl) | 12.5±1.8 | 12.0±1.9 | 11.8±2.0 |
| Creatinine (mg/dl) | 1.12±0.52 | 1.21±0.65 | 1.52±0.52** |
| EDVI (ml/m2) | 53.7±16.7 | 51.5±19.4 | 64.5±20.7*^ |
| ESVI (ml/m2) | 27.1±14.5 | 29.1±15.5 | 39.6±20.4 |
| Ejection fraction (%) | 42.8±4.5 | 41.2±6.5 | 43.5±5.2 |
| LV mass index (g/m2) | 88.5±28.5 | 92.2±30.0 | 112.6±24.1***^ |
| TAPSE (cm) | 16.5±4.6 | 12.7±2.6** | 11.3±4.3*** |
| RV base (cm) | 3.4±0.6 | 3.3±0.5 | 4.1±0.7***^^ |
| E (cm/s) | 86.1±28.5 | 113.5±26.5*** | 115.6±25.5*** |
| Stroke volume index (ml/m2) | 40.5±7.5 | 30.7±8.2* | 31.0±12.3* |
| Left atrial volume index (ml/m2) | 20.6±6.1 | 27.6±9.2*** | 48.2±17.4***^^^ |
| Tricuspid velocity (m/s) | 2.34±0.39 | 2.79±0.34*** | 3.17±0.48***^^ |
| E/e’ | 9.9+2.3 | 12.6±6.2 | 21.4±9.3***^^^ |
| E/A | 1.02±0.51 | 3.07±1.39*** | 2.89±0.58*** |
| Heart Failure Readmission (%) | 24.0 | 46.1* | 75.6***^ |
| All-cause mortality (%) | 24.0 | 53.8** | 43.2 |
3.1. Inter-observer and Intra-observer Variability
We have previously reported [6] the inter-observer and intra-observer variability for E/A, LAVI, E/e’, and TR velocity of 10 randomly chosen patients were reanalyzed 1 month following the initial analysis by 2 readers with random ordering. Intra-class correlation coefficients between observers were 0.95, 0.87, and 0.93, 0.91 for E/A, LAVI, E/e’, and TR velocity. The mean difference of absolute values between observations was 4.6±1.3%, 8.1±2.3%, 7.4±2.5, and 6.1±1.8%. Intra-class correlation coefficients for repeated observations by the same observer were 0.95, 0.89, 0.94, and 0.93 for the above parameters. The mean difference for the above parameters for the same observer was 3.8±1.3%, 6.7±2.2%, 5.1±1.9, and 3.5±1.3%.
4. DISCUSSION
In a cohort of HF patients with reduced ejection fraction, greater degrees of DDys led to increased risk of HF-R with only low-moderate predictability with grade 3 being more predictive than grade 2. Furthermore, within each grade of DDys, a greater number of criteria present (LAVI >34 ml/m2, E/e’ >14, or TR velocity >2.8 m/s) increased the risk of HF-R and the predictability. For grade 1 DDys, either 0 or 1 of 3 criteria are required. When comparing 0 criteria to any single criteria, there was an increased risk for HF-R with low-moderate predictability. For grade 2 DDys, 2 of 3 criteria are needed. When comparing any 2 criteria to patients with 0 criteria (reduced ejection fraction only), there was an increased risk of HF-R with low-moderate predictability which further increased to moderate predictability when all 3 criteria were met which demonstrated improvement over any 2 criteria. For grade 3 DDys, we demonstrated that E/A >2 with 0-1 criteria had increased risk for HF-R compared with 0 criteria (reduced ejection fraction only). Furthermore, E/A >2 and 2-3 criteria demonstrated increased risk of HF-R with moderate probability and a substantial improvement over E/A >2 and 0-1 criteria (AUC difference=0.12). Though RV function as measured by TAPSE was reduced in grade 2 and 3 DDys and with a greater number of positive criteria within grade 2 and grade 3 DDys, it was not an independent predictor of HF-R for grade 2DDys but only for grade 3 DDys.
4.1. Previous Literature
The use of DDys assessment to predict LV filling pressures started with observations noting that the restrictive diastolic filling pattern (increased E/A ratio and shortened deceleration time) correlated with elevated LV pressures [11, 12]. The use of E/e’ resulted in an improved correlation with measures of LV filling pressures [13, 14]. Patients following myocardial infarction who demonstrated either pseudo-normal or restrictive DF patterns had increased HF-R or all-cause mortality compared with the impaired relaxation pattern [15-24]. Similarly, the use of the E/e’ >15 was associated with increased all-cause mortality in patients with HF [25] and post myocardial infarction [16, 24]. Also, estimated pulmonary artery systolic pressure >35 mmHg was associated with increased HF and all-cause mortality [19].
In 2009, the ASE published guidelines for DF assessment including the prediction of LV filling pressures with only limited support for predicting HF-R all-cause mortality [1, 3, 4]. The 2016 DF guidelines were predictive of HF-R [3, 4] with LAVI as the only independent predictor of major adverse cardiac events [3, 4]. Using the Doppler-echocardiographic criteria proposed by the 2016 ASE guidelines, we have previously demonstrated that grade 2-3 DDys have an increased rate of HF-R for patients with HF with preserved, mid-range, and reduced ejection fraction [6].
The clinical data in our manuscript does not address LV filling pressures but does demonstrate a significant association for HF-R [26]. Compared with normal DF, Sanchis et al. (3) demonstrated in an HF clinic that the 2016 DF was more predictive of HF-R than the 2009 DF guidelines but outcomes did not differ based on the severity of DF grading. In a group of 419 patients post myocardial infarction, Prasad et al. [4] noted that patients with grade 2-3 DDys demonstrated an increased composite of all-cause mortality, HF-R, and recurrent myocardial infarction (HR=2.16) over 24-month follow-up. Following HF discharge in 222 patients, Torii et al. [27] demonstrated that estimated LV filling pressure elevation (grade 2-3 DDys) based on the 2016 guidelines was predictive of HF-R and mortality (HR=2.61, p<0.001) and additive to clinical predictors. Utilizing the Mayo clinic echo database of >57,000 patients (LV ejection fraction=60.3%), Liang [28] demonstrated increasing cardiovascular mortality with increasing DDys grade over a 3-year average from 0.71% (normal) to 11.74% (grade 3 DDys) [29-31]. Both LV ejection fraction and DDys grade predicted cardiovascular mortality. Using a DDys algorithm that 1st assessed for impaired relaxation and then assessed LAVI, E/e’ (color Doppler e’), and E/A >2 to assign DDys grade, Johansen et al. [32] in a cohort of 1851 patients assessed cardiovascular mortality, HF admission, and myocardial infarction. In multivariate analysis, they demonstrated that LAVI >34 ml/m2, E/e’ >17 (color Doppler e’), and E/A > 2 were predictive of the composite outcome as any DDys grade had significant hazard ratios for the composite outcome as compared to normal DF [33].
Our data add to the existing literature in that even grade 1 DDys with either LAVI >34 ml/m2, E/e’ >14, or TR velocity >2.8 m/s resulted in increased HF-R as compared to patients with a reduced ejection fraction alone. Furthermore, for grade 2 DDys having all 3 criteria was associated with greater HF-R compared with both a reduced LV ejection alone or any 2 criteria. Furthermore, even in grade 3 DDys, there was a similar gradient of risk noted with regard to the number of criteria present. Overlap between HF readmission risk with regard to grade 1, 2 and 3 DDys may be explained by these findings.
4.2. Clinical Implications
We examined a cohort of HF patients with reduced ejection fraction, DF and structural parameters and determined that HF-R was more likely with an increasing number of abnormal DF parameters (LAVI >34 ml/m2, TR velocity >2.8 m/s, or E/e’ >14) and had moderate predictability (AUC >0.7) when all 3 parameters were present in grade 2 DDys and grade 3 DDys (E/A >2) with 2 or 3 parameters. In grade 1 DDys, any of the 3 parameters were associated with greater HF readmission compared with patients with reduced ejection fraction and 0 criteria
Our study is a select group in that all patients had HF fulfilling the recently updated universal definition of HF [9] and having reduced ejection fractions. Our results are instructive in pointing out there is a gradient in the risk and predictability of HF-R based on the number of criteria present in grade 2 and 3 DDys. Individuals with grade 1 DDys who had any 1 of the 3 criteria also had an increased incidence of HF compared with patients with a reduced ejection fraction alone. This has implications in that labeling patients as grade 1 DDys and having none of the criteria present identifies a lower risk groups but a higher risk if any 1 of the 3 criteria is present. Similarly, a greater number of criteria with either grade 2 or 3 DDys also identifies a subgroup with a similar increased risk of HF-R. The ability for DDys grading based on Doppler echocardiography to predict HF outcomes requires further research to identify parameters that are more strongly related to HF-R and elevated LV filling pressures and whether more intense HF therapy might reduce risk based on the above parameters or newly identified parameters.
5. LIMITATIONS
As this was a retrospective evaluation of a community-based outpatient practice, it is limited by numbers and population diversity. Not all patients could be included based on ≥1 criteria not being recorded and evidence of merging of the E and A velocity. Specifically, the number of patients with grade 2 (94 patients) and grade 3 (63 patients) DDys are limited in number compared with grade 1. Despite the limitation of numbers for grade 2 DDys, there were important observations regarding the number of criteria present and HF-R outcome. Second, data abstraction was based on a chart review of both inpatient and outpatient recorded symptoms and medications. Third, HF-R may have occurred outside the East Tennessee area. The additional hospital system records in the area were available and reviewed for admissions. Fourth, laboratory values were not available in all patients for BNP (12% missing), with a non-significant difference among HF phenotypes ranging from 9-14% [6-9]. Finally, as this was a retrospective study, there may be additional unknown and unaccounted differences among DF groups.
CONCLUSION
In a community practice with an HF diagnosis and verified HF by the universal definition of HF, we noted there was an increased risk for HF-R based on DDys grade. Within each DF grade, there was a gradient of risk based on the number of DDys criteria present.
LIST OFABBREVIATIONS
| A | = Peak atrial filling velocity |
| ASE | = American Society Echocardiography |
| AUC | = Area under the curve |
| BNP | = Brain natriuretic peptide |
| DDys | = Diastolic dysfunction |
| DF | = Diastolic function |
| E | = Peak rapid filling mitral velocity |
| e’ | = Peak early mitral annular diastolic velocity |
| HF | = Heart failure |
| HF-R | = Heart failure readmission |
| LAVI | = Left atrial volume index |
| LV | = Left ventricular |
| ROC | = Receiver operating characteristics |
| RV | = Right ventricular |
| TAPSE | = Tricuspid annular plane systolic excursion |
| TR-V | = Tricuspid regurgitation velocity |
ETHICS APPROVAL AND CONSENT TO PARTICIPATE
This study received expedited approval from the Quillen College of Medicine Institutional Review Board.
HUMAN AND ANIMAL RIGHTS
No animals were used for studies that are the basis of this research. All the humans were used in accordance with the ethical standards of the committee responsible for human experimentation (institutional and national), and with the Helsinki Declaration of 1975, as revised in 2013 (http://ethics.iit.edu/ecodes/node/3931).
CONSENT FOR PUBLICATION
The written informed consent form was taken from the patients and volunteers.
STANDARDS OF REPORTING
STROBE guidelines were followed.
AVAILABILITY OF DATA AND MATERIALS
The datasets generated and analyzed during the current study are not publically available due to the request of the Institutional Review Board.
FUNDING
This study was supported by American Heart Association Summer Student Stipend.
CONFLICT OF INTEREST
Steven Lavine is on the Editorial Advisory Board of the journal The Open Cardiovascular Medicine Journal.
ACKNOWLEDGEMENTS
We would like to thank the American Heart Association summer student stipend fund for the support of Danielle Kelvas between her 1st and 2nd year of medical school.