All published articles of this journal are available on ScienceDirect.

Predictors of Impaired Left Ventricular Global Longitudinal Strain in Patients with Essential Hypertension and Preserved Ejection Fraction
Abstract
Background:
Early identification of hypertensive patients at risk of heart failure (HF) helps guide treatment intensification and predict prognosis. Global longitudinal strain (GLS) derived from two-dimensional speckle-tracking echocardiography (STE) uncovers subclinical left ventricular (LV) systolic dysfunction (SLVSD) in patients with hypertension (HT) and preserved LV ejection fraction (PLVEF). STE is unavailable and/or underutilized in our locality for financial and technical reasons.
Objectives:
We aim to identify clinical and echocardiographic parameters associated with and/or predictive of impaired GLS in hypertensive patients with PLVEF.
Method:
In this single-clinic, cross-sectional, observational study, 100 hypertensive patients with PLVEF were examined using conventional and 2D STE.
Results:
The average GLS was found to be mildly reduced (-18.4 ± 2.2%) in the study group. Lower GLS (than -19%) was more common among patients with poorly controlled HT (Odds Ratio (OR)=9), being on multiple anti-hypertensive agents (OR=5), positive Sokolow-Lyon electrocardiographic criteria (OR=4.3), and obesity (OR=2). Conventional echocardiographic parameters predicting impaired GLS included: mitral annular plane systolic excursion (MAPSE) (p=0.001), inter-ventricular septal thickness (IVSd) (p=0.003), LV mass (p=0.003), and LV remodelling (p=0.02). The aortic acceleration-to-ejection time ratio (AT/ET) had a good correlation with GLS (p=0.034). The novel product (IVSd x AT/ET) ≥2.7 mm was found to be the best predictor of GLS worse than -19% (AU ROC=0.8, 95% CI [0.68-0.93]; p=0.001).
Conclusion:
In hypertensive patients with PLVEF, GLS was found to correlate well with blood pressure (BP) control, body size, measures of LV mass, and MAPSE. These parameters predict at least 50% of the variance in GLS and could help practitioners with limited access to STE in risk-stratifying hypertensive patients.
1. INTRODUCTION
Systemic hypertension (HT) is a leading cause of heart failure (HF), cerebrovascular, cardiovascular, and renal disease [1]. Accurate diagnosis of HT, early institution of aggressive lifestyle measures, and initiation of appropriate anti-hypertensive medications to achieve blood pressure (BP) targets are cornerstones of HT management. Due to the observed long-term benefits of maintaining normal-range BP, recent international guidelines have recommended more strict HT control [2].
Hypertensive heart disease (HHD) encompasses progressive left ventricular (LV) diastolic dysfunction (LVDD), LV hypertrophy (LVH), dilatation of the left atrium (LA) and ascending aorta, and pulmonary hypertension secondary to elevated left heart filling pressures. Ultimately, HF with preserved (HFpEF) or reduced ejection fraction (HFrEF) ensues due to chronic pressure overload [3]. Deterioration of LVEF is an ominous sign marking the failure of compensatory physiological adaptations. Furthermore, the development of LVH has independent prognostic implications in HHD. LVH and myocardial fibrosis predict the occurrence of major adverse cardiovascular events (MACE) [4], including the development of HF [5] and sudden cardiac death [6].
Speckle tracking echocardiographic (STE) examination of myocardial deformation is a novel technique that is useful in detecting subclinical LV systolic dysfunction (SLVSD). STE provides strong prognostic information regarding a wide variety of cardiovascular conditions like cardiomyopathies, ischemic and valvular heart disease, and chemotherapy-related cardio-toxicity [7]. Numerous studies recruited STE-derived strain in the evaluation of hypertensive patients [8-10]. Impairment of global longitudinal LV systolic strain (GLS) precedes most classical alterations of HHD and is promising in identifying patients at risk of progressing to HF at an earlier stage i.e., stage A [11] of the disease [12].
Due to numerous financial and technical reasons, STE has limited availability in our locality. It is also significantly underutilized by echocardiographers in our city because of their perceived operator dependency and the time-consuming acquisition process.
In this study, we aim to identify clinical and echocardiographic parameters that are associated with and/or predictive of impaired GLS in hypertensive patients with preserved LV ejection fraction (PLVEF). We hypothesize that a significant proportion of the variance in measured GLS can be explained by a few simpler, easily-measured observations.
2. PATIENTS AND METHODS
2.1. Study Design and Participants
This is a single-clinic, cross-sectional, observational study. We included 100 consecutive hypertensive adults visiting to establish HT care in our outpatient cardiology clinic in Erbil City, Iraq, between December, 2021 and March, 2022. HT is defined as systolic BP ≥140 mmHg, diastolic BP ≥90 mmHg, or being on anti-hypertensive medications. Only patients 18 years and older, with an established prior diagnosis of essential HT for a duration of ≥ 1 year, were included.
Patients were excluded if they had any one of the following:
- Poor echocardiographic windows.
- Suboptimal automated speckle tracking of more than one myocardial segment.
- An ejection fraction below 55%.
- Any LV regional wall motion abnormalities.
- Atrial fibrillation, frequent ectopics, left bundle branch block, paced rhythm, or atrioventricular block.
- Known secondary causes of HT.
- Known chronic kidney disease, retinopathy, or cerebrovascular disease.
- Symptoms or signs of HF, with or without raised natriuretic peptides.
- History of acute or chronic coronary syndromes.
- Significant valvular heart disease (more than mild aortic or mitral valve insufficiency).
- Hypertrophic cardiomyopathy.
- Congenital heart disease.
- Previous cardiac surgery.
- Pericardial disease.
- Pregnancy.
Ethical approval was obtained from the Kurdistan Higher Council of Medical Specialties (listed 1737 on 20th December, 2021) prior to enrolment.
2.2. Basic Data Collection
All patients provided written informed consent before inclusion. A questionnaire was used to collect basic data about the patients, including age, gender, weight, height, body surface area (BSA), body mass index (BMI), past medical history, and risk factors (diabetes mellitus (DM): fasting blood glucose ≥126 mg/dL, random blood glucose ≥200 mg/dL, or glycated haemoglobin A1c (HbA1c) ≥6.5%; dyslipidaemia: serum low-density lipoprotein-cholesterol (LDL-C) ≥130 mg/dL, serum triglycerides ≥150 mg/dL, or serum high-density lipoprotein-cholesterol (HDL-C) below 40 mg/dL for men or 50 mg/dL for women; obesity (body mass index (BMI) ≥30 kg/m2), overweight (BMI 25-29 kg/m2); cigarette smoking), duration and degree of control of HT (subjectively assessed with direct questioning about averaged BP readings in the preceding 3 months at home or office), and current anti-hypertensive drug therapy (dosage not recorded). BP was measured according to the 2020 International Society of Hypertension Global Hypertension Practice Guidelines [2] using a mercury sphygmomanometer.
2.3. Electrocardiography (ECG)
Standard resting 12-lead surface ECG was recorded for every participant. Patients were classified into three subgroups according to Sokolow-Lyon and modified Cornell criteria of LVH: (1) normal ECG, (2) positive voltage criteria, and (3) positive voltage criteria with additional LV strain pattern (i.e., asymmetrical T-wave inversion in lateral leads).
2.4. Conventional Echocardiography
Two-dimensional, ECG-gated trans-thoracic echocardiography (TTE) was performed using a General Electric (GE) Vivid T9 (GE Vingmed Ultrasound, Horten, Norway) with phased array 3SC-RS 2.0-4.0 MHz probe by an experienced cardiologist. B-mode and m-mode image acquisition was carried out in the parasternal long-axis view. Measurements included inter-ventricular septal (IVSd) and posterior (PWTd) wall thickness at end-diastole and LV internal dimensions during diastole (LVEDD) and systole (LVESD). Relative wall thickness (RWT) was calculated as the ratio of twice the PWTd to the LVEDD. EF was calculated using the modified Simpson’s biplane method of discs with a manual tracing of LV endocardial borders in the apical four-chamber (A4C) and apical two-chamber (A2C) views both at end-diastole and systole. LV end-diastolic (LVEDV) and end-systolic (LVESV) volumes and biplane left atrial volume (LAV) were indexed to BSA. LV mass (LVM) was calculated by tracing the epicardial and endocardial borders in the parasternal short axis view at end-diastole, together with LV long axis measurement in A4C. LV geometrical remodelling was classified depending on RWT and LVM index (LMVI) values [13]. Mitral annular plane systolic excursion (MAPSE) was measured laterally with m-mode in A4C. Myocardial performance index (Tei Index) was calculated with tissue Doppler imaging (TDI) of the lateral mitral annulus as the ratio of the sum of isovolumic contraction and relaxation times to systolic ejection time and indexed to a heart rate of 75 bpm. The aortic valve (AV) acceleration-to-ejection time ratio (AT/ET) was calculated from a continuous-wave Doppler signal obtained in the apical five-chamber (A5C) view. Parameters of LV diastolic function were assessed using pulsed-wave echocardiography in A4C and included mitral E and A wave velocities, E/A ratio, and E wave deceleration time (DT). Mitral e’ velocities at the septal and lateral annular positions were measured with TDI, averaged, and used to calculate E/e’ ratio. Grading LVDD was done as per ASE guidelines [14].
2.5. Two-dimensional STE-derived Strain Analysis
Offline GE speckle tracking software (Automated Function Imaging) was used to calculate GLS. The acquired ECG-gated, grey-scale cine loops obtained from the A3C, A4C, and A2C were saved. AV closure time was verified in A3C. Manual correction of tracing and thickness of LV myocardial region of interest (ROI) was performed if automated tracking was deemed suboptimal. The average value of three beats recorded at expiration was used as the final GLS. From the 17 myocardial segments in the bulls-eye view, the one with the lowest strain value was also noted.
2.6. Statistical Analysis
Data were analysed with SPSS 25.0 (IBM, Armonk, New York, USA).
Continuous variables were expressed as mean ± standard deviation, while categorical variables were shown as frequencies and percentages. Student’s t-tests were used to compare continuous variables, chi-squared or Fisher’s exact tests for dichotomous data (reporting odds ratio (OR) when applicable), and one-way ANOVA for categorical variables with three or more subgroups.
The normality of data distribution was checked with the Shapiro-Wilk test. In case correlation was being tested, Pearson’s and Spearman’s correlation coefficients (r) were reported for parametric and nonparametric data, respectively. Multivariate stepwise linear regression analysis was used to determine variables with the strongest relationship to GLS.
A two-sided p<0.05 was considered significant.
3. RESULTS
3.1. Clinical Characteristics of the Study Group
Among the enrolled 100 hypertensive patients fulfilling the inclusion criteria, the rate of exclusion due to poor image quality and/or suboptimal speckle tracking was about 7% (feasibility 93%).
Table 1 lists the clinical characteristics of the enrolled patients. Dyslipidaemia (41%), DM (20%), and smoking (25%) were common. A minority of patients had a normal BMI (8%).
| Parameter | Value ± Standard Deviation |
|---|---|
| (A) Clinical Characteristics | |
| Age (years) | 52.5 ± 11.8 |
| Gender (males), n (%) | 42 (42) |
| Weight (kg) | 81.5 ± 13.5 |
| Height (cm) | 160.9 ± 10.1 |
| Body mass index (BMI) (kg/m2) | 31.4 ± 5.0 |
| Body surface area (BSA) (m2) | 1.9 ± 0.2 |
| Systolic blood pressure (SBP) (mmHg) | 144.9 ± 19.3 |
| Diastolic blood pressure (DBP) (mmHg) | 87.6 ± 10.1 |
| Mean arterial pressure (MAP) (mmHg) | 106.6 ± 12.4 |
| Resting heart rate (HR) (bpm) | 80.1 ± 12.8 |
| Duration of hypertension (years) | 5.3 ± 6.4 |
| Well-controlled blood pressure, n (%) | 48 (48) |
| (B) Echocardiographic Data | - |
| Inter-ventricular septal thickness in diastole (mm) | 11.1 ± 1.6 |
| Posterior left ventricular wall thickness in diastole (mm) | 10.7 ± 1.4 |
| Left ventricular internal dimension in end-diastolic (mm) | 44.7 ± 4.1 |
| Left ventricular internal dimension in end-systolic (mm) | 31.3 ± 4.1 |
| Left ventricular end-diastolic volume (LVEDV) (mL) | 80.6 ± 25.7 |
| LVEDV/BSA (mL/m2) | 43.4 ± 13 |
| Left ventricular end-systolic volume (LVESV) (mL) | 31.1 ± 10.7 |
| LVESV/BSA (mL/m2) | 16.8 ± 5.4 |
| Biplane left ventricular ejection fraction (%) | 63.8 ± 4.5 |
| Left ventricular relative wall thickness (ratio) | 0.47 ± 0.08 |
| Left ventricular mass (LVM) (g) | 178.0 ± 52.8 |
| LVM/BSA (g/m2) | 94.9 ± 22.9 |
| Left atrial volume (LAV) (mL) | 48.5 ± 20.7 |
| LAV/BSA (mL/m2) | 27.7 ± 14.3 |
| Myocardial performance (Tei) index (ratio) | 0.56 ± 0.15 |
| Mitral E wave velocity (cm/sec) | 67.7 ± 14.7 |
| Mitral A wave velocity (cm/sec) | 81.9 ± 18.4 |
| Mitral E/A (ratio) | 0.83 ± 0.23 |
| Mitral E wave deceleration time (msec) | 225.6 ± 51.1 |
| Mitral lateral annular tissue Doppler velocity e’l (cm/sec) | 10 ± 2.1 |
| Mitral septal annular tissue Doppler velocity e’s (cm/sec) | 7.9 ± 2.2 |
| Mitral E wave to averaged e’ ratio (E/e’) (ratio) | 7.9 ± 2.3 |
| Aortic valve acceleration to ejection time ratio (AT/ET) (ratio) | 0.27 ± 0.04 |
| Left ventricular global longitudinal systolic strain (GLS) (%) | -18.4 ± 2.2 |
| Lowest regional longitudinal strain (%) | -14.5 ± 2.7 |
| Myocardial segment with lowest longitudinal strain, n (%) | Basal anterior or lateral, 50 (50) |
3.2. Conventional Echocardiography and 2D STE-derived Strain
The average EF was 63.8 ± 4.5%, as shown in Table 1. GLS was mildly reduced in hypertensive patients (-18.4 ± 2.2%). Generally, the lowest strain values were recorded in basal myocardial segments rather than LV mid or apical regions (i.e., there is an apical-to-basal gradient in regional longitudinal strain).
3.3. Correlations and Predictors of GLS in Hypertensive Patients
3.3.1. GLS is Related to Anthropometry, BP Control, and Antihypertensive Therapy
Age and gender were not independently related to strain. We observed impaired GLS in patients with larger body sizes in terms of weight (r=0.41, p=0.003), BMI (r=0.3, p=0.01), and BSA (r=0.36, p=0.03) but not height alone.
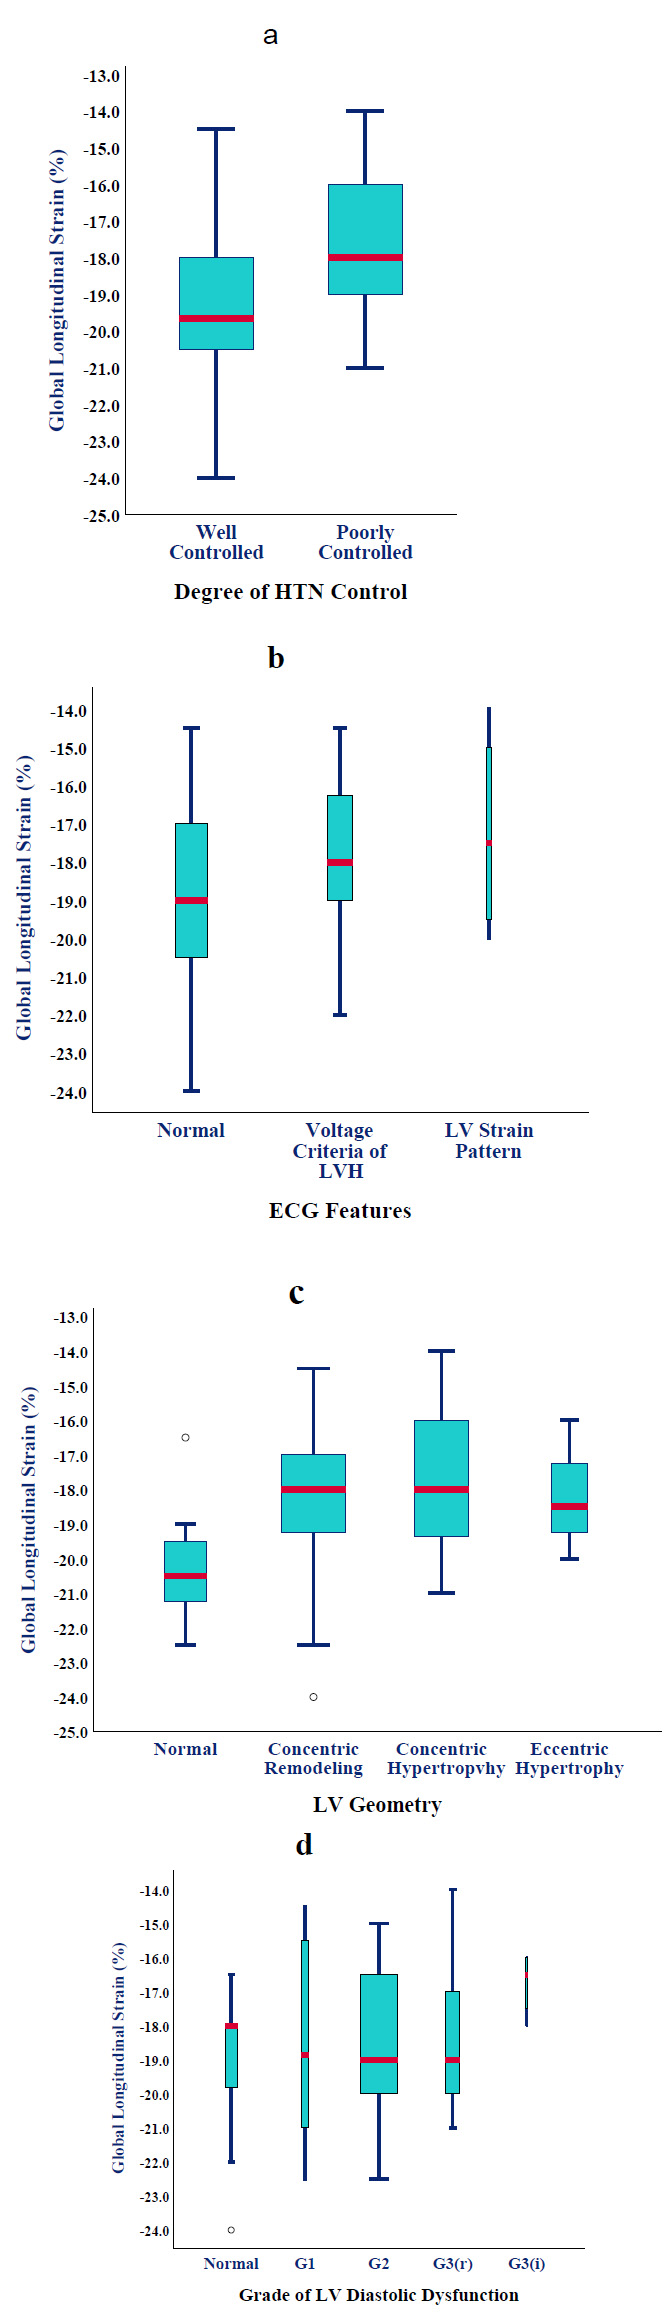
Office BP measured immediately before the echocardiographic examination was not strongly related to GLS. However, patients with a history of poorly controlled HT (52%) had substantially lower GLS than those within BP targets (17.47 ± 1.78 vs. -19.33 ± 2.28%, p=0.002) (Fig. 1a). This translated into nine-fold higher odds of having GLS <-19%. In patients with apparently well-controlled HT, a thicker IVS, higher LVMI, and larger LVEDV (increased wall stress according to Frank-Starling law) were most predictive of SLVSD (ANOVA, p<0.0001). All patients were on at least one anti-hypertensive agent for the last year. We observed gradually worsening GLS (than -19%) as patients required combination therapy (OR=5, 95% CI [2-8]; p=0.02). No particular drug class was noticed to be associated with improved strain, except for a marginal advantage for beta-blockers.
3.3.2. Electrocardiographic Features and their Correlation with GLS
Approximately half of the hypertensive cases (52%) had a normal ECG, while 40% met the voltage criteria for LVH, and 8% showed a strain pattern as well. Although mean GLS was progressively worse across the three subgroups (-18.9 ± 2.34%, -17.9 ± 1.8%, and -17.2 ± 2.75%, respectively) (Fig. 1b), statistical significance was not met (p=0.2).
3.3.3. Any LV Remodelling Correlates with Impaired GLS
Concentric remodelling was the commonest LV geometry (48%), followed by concentric hypertrophy (32%), normal geometry (14%), and eccentric hypertrophy (6%). The presence of any type of LV remodelling was associated with worse GLS compared to normal geometry (-18.1 ± 2.1 vs. -20.1 ± 2%, p=0.027 by Fisher’s exact test) ((Fig. 1c) but not within the remodelling subtypes (p=0.2 by one-way ANOVA).
3.3.4. Correlation and Predictive value of 2D and Doppler-derived Echocardiographic Parameters with GLS
EF was not significantly related to GLS (p=0.15). On bivariate analysis, the strongest correlations of conventional echocardiographic parameters with GLS were (r; p-value): LV mass (0.41; 0.003), IVSd (0.41; 0.003), MAPSE (-0.4; 0.004), and PWTd (0.4; 0.005). On stepwise linear regression analysis, MAPSE and LMV explained at least 40% of the observed variance in GLS.
Patients with progressive LVDD tended to have a non-significant but steady decline in strain from normal through LVDD grades 1, 2 (reversible), 2 (irreversible), and 3 (-19.1 ± 0.4%, -18.5 ± 3.1%, -18.4 ± 1.95%, -18.2 ± 2.3%, and -16.75 ± 1%, respectively; p=0.25) (Fig. 1d).
3.3.5. Correlation of Novel Echocardiographic Parameters with GLS
Interestingly, indexing EF to both LVM and BMI (EF/LVM/BMI) did result in a stronger correlation with GLS (r=-0.46; p=0.001), more robust than any of the three variables in isolation. Furthermore, the myocardial energetic efficiency index (defined as MEEi=SV/HR/LVM) was closely related to GLS (r=-0.42, p=0.002), although losing its predictive power in the regression model.
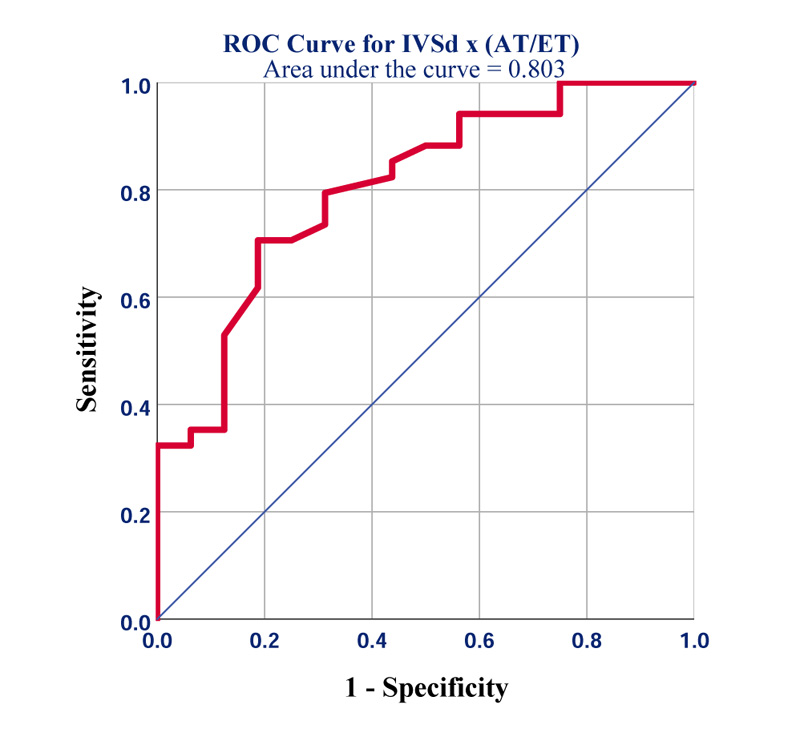
We found that the novel product of IVSd x AT/ET not only significantly correlated with GLS (r=0.45; p=0.001) but turned out to be the best predictor of GLS worse than -19% (area under the receiver operating characteristic curve (AU-ROC) =0.8, 95% CI [0.68-0.93]; p=0.001) (Fig. 2). The best diagnostic accuracy was seen at a cut-off of ≥2.7mm (sensitivity=80%; specificity=70%).
4. DISCUSSION
4.1. Scope of the Problem
Systemic HT is a major predisposing factor to the development of HF with either preserved or reduced EF [15]. HF portends a significant residual risk of death and hospitalization despite the best medical therapy, which is frequently challenging to implement [16]. The transition between stages B and C of HF marks a sizable leap in terms of 5-year survival [17]. Earlier identification of patients with structural and/or functional abnormalities (i.e., at stage A of HF) improves risk stratification and allows the selection of patients who would benefit from more intensive lifestyles and risk factor modification. STE-derived GLS is a sensitive marker of SLVSD in patients with HT, with abnormalities detected ahead of the development of LVH and even LVDD [18, 19]. In a recent survey of two major hospitals delivering cardiovascular care in our city, less than 5% of attending cardiologists ever utilized GLS, citing either unavailability or the perception of long examination times and operator dependency.
4.2. Pertinent Findings from the Present Study
In this single-clinic, cross-sectional, observational study, we evaluated patients with HT and PLVEF using standard echocardiography in addition to 2D STE-derived GLS. We aimed at identifying simpler clinical and echocardiographic parameters from which an impaired GLS can be inferred, thus helping the under-equipped practitioners in better risk stratification of hypertensive patients.
The most important findings from the current study were: (1) Patients with uncomplicated HT were found to have mildly impaired LV GLS measured at rest using 2D STE. (2) GLS was observed to strongly correlate with the degree of HT control, especially if associated with higher LVMI and increased LV wall stress (larger LVEDV). Patients requiring multiple antihypertensive medications (a marker of difficult-to-control or resistant HT) also had significantly worse GLS. (3) The development of any type of LV geometrical remodelling was associated with impairment of GLS, progressively progressing from concentric remodelling, the most common subtype in our study, to concentric and eccentric hypertrophy. (4) Few echocardiographic variables could predict at least 50% of the variance in GLS, including indexed EF (ratio of EF/LVM/BMI), measures of LV mass (LVM, IVSd, and PWTd), MAPSE (a direct measure of longitudinal basal LV motion), AT/ET ratio, and mitral a-wave velocity. (5) The novel product of IVSd x AT/ET (with a cut-off of ≥2.7) provides the best single predictor of a GLS of worse than -19%.
4.3. Correlation of Clinical Data with GLS
Similar to Sengupta et al. [20] and Baral et al. [21], we demonstrated mild impairment in resting GLS in patients with uncomplicated HT. This is observed as early as mild-to-moderate HT is diagnosed [22, 23]. In a meta-analysis involving 2187 predominantly uncomplicated HT patients, GLS was significantly reduced compared to 2089 normotensive controls (standardised mean difference (SMD)=1.07 ± 0.15, 95% CI [0.77-1.36]; p<0.0001), including aged matched sub-group (SMD=1.21 ± 0.23, 95% CI [0.76-1.67]; p=0.002) [10].
As the compensatory hypertrophy and remodelling progress to the HF syndrome, gradual worsening of GLS was seen with average values ranging from -20.16 ± 2.75% in normal controls, -18.27 ± 3.74% in hypertensive patients with PLVEF, and -11.34 ± 3.85% in hypertensive with reduced EF [24]. Attenuation of regional and GLS was reported to be proportional to symptom severity and the presence of congestion [25]. In multilayer analysis of GLS in hypertensive patients, the sub-endocardium was identified as the earliest layer to be involved [8, 9].
The majority of patients in our hypertensive cohort (92%) were either overweight or obese. This is drastically above the observed average in our community [26]. The pure effect of body weight on GLS could not be ascertained adequately in our study because of the small number of enrolled cases with normal weight.
In obese and overweight patients with no other cardiovascular risk factors, 3D STE-measured GLS is found to be consistently low [27-30]. This phenomenon is even noticed in obese children, who lack most of the classical cardiovascular risk factors that could potentially affect GLS [31]. Thus, encouraging weight loss and a healthy lifestyle may potentially improve clinical outcomes in these patients. Indeed, bariatric surgery for morbid obesity usually translates into enhanced myocardial performance and deformation [32, 33].
Comorbidities like dyslipidaemia (41%) and DM (20%) were commonly encountered in our study group. DM, along with dyslipidaemia is also well-known to worsen GLS in hypertensive patients [34, 35]. Furthermore, cigarette smoking, which independently impairs GLS [36, 38], was regularly practiced by 25% of our patients.
In our study group, at least half of the patients had above-target BP, close to our national average [26]. However, their average BP was 155/92 mmHg, signifying mild-to-moderate HT. It has been observed that patients with resistant, masked, or poorly controlled HT generally exhibit SLVSD and reduced GLS [39-41]. Requiring more anti-hypertensive medications is a marker of difficult-to-control HT and is associated with impaired strain in our study. Patients with HT and asymptomatic SLVSD derive the greatest benefit from appropriate pharmacotherapy [42]. Generally, the improvement in GLS is largely related to the reduction in LVMI rather than mere BP lowering [43].
4.4. Correlation of Echocardiographic Parameters with GLS
Determinants of STE-derived GLS are numerous, with significant interaction and interdependence. The relationship between EF, wall thickness, and GLS is logarithmic [44]. It has been observed that the novel ratio of EF/LVM/BMI was particularly predictive of SLVSD in patients with HT, even ahead of LVDD. This ratio partially corrects the complex relationship between these variables [45, 46]. Co-existing DM and metabolic syndrome are also known to reduce indices of myocardial efficiency [47].
Other echocardiographic parameters that may correlate with GLS include:
4.4.1. Heart Rate
GLS is inversely related to heart rate, and we observed slightly better strain in patients on beta-blockers. Hensel et al. [48] demonstrated the inferior ability of hypertensive patients to augment LV strain during echocardiographic stress testing (higher heart rate).
4.4.2. LV Diastolic Function [49, 50]
This relationship is mainly mediated by LV geometrical remodelling, independent of afterload changes [51]. Elevated E/e’ ratio is related to systolic and diastolic abnormalities in primary HT [52]. Nonetheless, the correlation did not reach statistical significance in our analysis (only a few patients had elevated filling pressure).
4.4.3. Myocardial Tissue Doppler e’ and s’ Velocities and MAPSE [53]
These parameters measure longitudinal LV motion and, in line with our findings, are closely related to GLS.
4.4.4. Tei Index [54, 55]
The relationship is compounded by heart rate and relative wall thickness, which were also partially reproduced in our study.
4.4.5. LV Geometrical Remodelling [56]
As shown in our results, GLS declines steadily from normal geometry to concentric remodelling, followed by concentric and eccentric LVH, irrespective of BP [57]. We noted a direct relationship between LVEDV and strain, signifying increasing wall stress in uncontrolled HT.
4.4.6. Acceleration-to-ejection Time Ratio (AT/ET)
Although validated in studies on aortic valve stenosis [58, 59], we included this variable based on the pathophysiological resemblance of increased afterload and demonstrated a good correlation with GLS. It is relatively easy to calculate with reasonable sensitivity and specificity and would best be utilized by practitioners with limited access to STE.
4.5. Bottom Line: Does GLS Provide Indispensable Information? How does GLS Further Help Guide HT Management?
Although a significant proportion of the observed variance in GLS can be accounted for by the clinical and echocardiographic parameters described earlier, GLS is still believed to provide unique prognostic information that might otherwise remain uncovered. This is particularly true for layer-specific subepicardial GLS [60].
We believe that addressing the reversible factors found to predict an impaired GLS is expected to improve clinical outcomes and reduce MACE in HHD. Thus, patients with well-controlled HT, optimized preload, healthy weight, and well-managed comorbidities (DM, dyslipidaemia, and smoking) are not only less likely to exhibit impaired strain but also less amenable to further HT-related therapeutic interventions. If such patients still manifested impaired GLS, the underlying mechanisms could include advancing age and myopathies of ischaemic or non-ischaemic aetiology. Reverse-remodelling of LVH and early myocardial fibrosis are seen more commonly in hypertensive patients treated with renin-angiotensin-aldosterone system inhibitors [61] and beta-blockers [62].
4.6. Study Limitations
BP control was assessed by direct questioning and office measurement. Although the correlation with GLS was strong, 24-h ambulatory BP monitoring would have been more accurate in defining a continuum [40]. We did not exclude underlying IHD directly with non-invasive or invasive testing, and thus the contribution of asymptomatic stable IHD to the reduced GLS could not be ascertained.
Patients with co-existing DM, dyslipidaemia, and smoking were not excluded, although these factors clearly affect strain [34-38]. Radial and circumferential strains were not measured, given the earlier reported drop in the longitudinal direction [24] and their compensatory increase aiming at preserving EF. Furthermore, 3D multi-directional strain is a more comprehensive method of evaluation of LV function than 2D STE [63, 64]. Finally, the small sample size could explain the minor differences in the results compared to previous studies.
CONCLUSION
GLS is mildly impaired in patients with uncomplicated HT and PLVEF. GLS correlates well with BP control, body size, measures of LV mass, MAPSE, and the development of LV remodelling. These parameters predict at least 50% of the variance in GLS and would help practitioners with limited access to STE to improve their risk stratification of hypertensive patients. However, GLS is indispensable and should ideally be utilized in the comprehensive management of HHD.
LIST OF ABBREVIATIONS
| HF | = Heart Failure |
| GLS | = Global longitudinal strain |
| STE | = Speckle-tracking Echocardiography |
| LV | = Left Ventricular |
| SLVSD | = Systolic Dysfunction |
| HT | = Hypertension |
| PLVEF | = Preserved LV Ejection Fraction |
| BP | = Blood Pressure |
ETHICS APPROVAL AND CONSENT TO PARTICIPATE
Ethical approval was obtained from the Kurdistan Higher Council of Medical Specialties (No. 1737 on 20th December, 2021).
HUMAN AND ANIMAL RIGHTS
No animals were used in the studies that are the basis of this research. All the humans were used in accordance with the ethical standards of the committee responsible for human experimentation (institutional and national) and with the Helsinki Declaration of 1975, as revised in 2013 (http://ethics.iit.edu/ecodes/node/3931).
CONSENT FOR PARTICIPATION
Written informed consent was obtained from participants prior to enrolment.
STANDARDS OF REPORTING
STROBE guidelines were followed.
AVAILABILITY OF DATA AND MATERIALS
The data that support the findings of this study are available from the corresponding author [A.A.N] upon reasonable request.
FUNDING
None.
CONFLICT OF INTEREST
The authors declare no conflicts of interest, financial or otherwise.
ACKNOWLEDGEMENTS
Declared none.