All published articles of this journal are available on ScienceDirect.

Aortic Area as an Indicator of Subclinical Cardiovascular Disease
Authors Info & Affiliations
Abstract
Aim:
Outward arterial remodeling occurs early in cardiovascular disease (CVD) and, as such, measuring arterial dimension may be an early indicator of subclinical disease.
Objective:
The objective of our study was to measure area at three aortic locations: The ascending thoracic (ASC), the descending thoracic (DSC), and the abdominal (ABD), and to test for association with traditional CVD risk factors and subclinical CVD throughout the body.
Methods:
We measured ASC, DSC, and ABD using computed tomography (CT) in 408 African ancestry men aged 50-89 years. We assessed prevalent CVD risk factors via participant interview and clinical exam, and subclinical CVD, including carotid atherosclerosis through B-mode carotid ultrasound, vascular calcification via chest and abdominal CT, and arterial stiffness via pulse-wave velocity (PWV).
Results:
As expected, all aortic areas were in correlation with each other (r=0.39-0.63, all p<0.0001) and associated with greater age, greater body size, and hypertension (p≤0.01 for all). After adjustment for traditional CVD risk factors, ASC was positively associated with carotid atherosclerosis (p<0.01). A greater area at each location was associated with greater PWV (p<0.03 for all), with the DSC region showing the most significant association.
Conclusion:
This is the first study to test the association of aortic area measured at multiple points with subclinical CVD. We found that combined CT assessment of ascending and descending aortic area may indicate a high risk of prevalent subclinical CVD elsewhere in the body independent of age, body size, and blood pressure.
1. INTRODUCTION
The prevalence of hypertension is escalating at alarming rates in African Americans and other African ancestry populations around the world [1]. Geographical regions with African ancestry populations are expected to have the largest proportional increases in hypertension in the coming decades [2]. In order to handle the greater force exerted on the arterial wall from high blood pressures, arteries throughout the vasculature dilate, a process known as outward arterial remodeling [3]. Carotid diameter is an established marker of subclinical cardiovascular disease (CVD), and is associated with increased blood pressure, age, body size, and other cardiovascular risk factors [4-6]. In addition, high blood pressure also makes arteries vulnerable to damage and atherosclerosis [3, 7]. As atherosclerotic plaque occurs in the arterial wall, lumen diameter decreases. Thus, there exists a relationship between blood hemodynamics, arterial diameter, and atherosclerotic plaque.
All arteries, including the aorta, undergo this outward remodeling [3]. While the proximal aorta, including the ascending region and arch, has been studied as a marker of subclinical disease [8, 9], it is generally considered to primarily reflect the risk of aneurysm development [8, 10-13]. Due to its distance from the heart, the descending and/or abdominal aortic size may be more reflective of general arterial remodeling [14]. Given that the full thoracic aorta is captured on clinical cardiac computed tomography (CT) scans, assessment of its size throughout the chest has great potential utility to gauge not only risk of aneurysm, but other subclinical diseases as well. However, there have been very few epidemiologic studies on aortic size outside of the proximal location, and none of them showed the ability to compare it with other established subclinical cardiovascular disease (CVD) markers.
Therefore, the purpose of this study was to use a novel method to measure the aortic diameter at three locations along its length: 1) proximal and2) distal to the heart in the thoracic cavity, and 3) in the abdomen, and to test the association of these measures with established markers of subclinical CVD in a population-based cohort of individuals with a large burden of hypertensive disease. We conducted this study involving 408 African Caribbean men from the Tobago Health Study who had chest and abdominal CT scans, in addition to, multiple aspects of subclinical CVD measured at the same time.
2. MATERIALS AND METHODS
2.1. Tobago Health Study (THS)
Between 1997 and 2003, previously unscreened 3,170 men aged 40-79 were recruited for a population-based prostate cancer screening study on the Caribbean island of Tobago, Trinidad and Tobago [15]. To be eligible, men had to be ambulatory, noninstitutionalized, and not terminally ill. Approximately 60% of all age-eligible men on the island participated (n=3375), and participation was similar across the island parishes. Between 2014 and 2016, 856 men were recruited for a follow-up clinical examination that included measures of subclinical CVD and chest and abdominal CT in a subset of individuals. The current analysis included 408 men from the follow-up visit who had aortic area measured, as well as data for all other subclinical CVD measures. The Institutional Review Boards of the University of Pittsburgh and the Tobago Ministry of Health and Social Services approved this study. All participants provided a written informed consent.
2.2. Computed Tomography (CT)
Thoracic and abdominal aortic areas were measured from the chest and abdominal CT scans collected using dual slice, high-speed NX/I computed tomography (GE Medical Systems, Waukesha, WI, USA). Digital imaging and communications in medicine (DICOM) images were securely sent electronically from Tobago to the Vanderbilt University Medical Center for archiving and analysis. Experienced analysts (JGT and SN) trained by a board-certified radiologist (JJC) identified and measured aortic area at all three locations using an Apple workstation running customized OsiriX MD software (https://www.osirix-viewer.com). The ascending (ASC) and descending (DSC) thoracic aortic areas were measured on the same transverse plane at the location of the pulmonary artery. While the abdominal (ABD) aortic area was measured above the bifurcation of the abdominal aorta proximal to where it splits into the iliac arteries. In each case, the vessel was visualized in OsiriX MD 3D multiplanar reconstruction mode to determine the centerline of the artery. The outer wall of the aorta was circumscribed and measured orthogonally to the vessel centerline. The mean of three contiguous 3 mm thick CT slices was used for each aortic area measure. These measures had an intra-class correlation coefficient of 0.92 in a 5% re-read of the study participants.
The use of non-contrast CT for measurement of aortic dimensions was validated in cynomolgus monkeys by comparing CT-derived dimensions with those measured in situ in exsanguinated monkeys sacrificed as part of another experiment. Whole-body CT imaging was performed on anesthetized monkeys using a Toshiba 32 slice scanner (Tokyo, Japan) at 120 kVp and 300 mA and a helical pitch of 21, pitch factor=0.625 with 0.5 sec rotation speed. The thoracic aorta was contoured on contiguous 0.5 mm axial CT slices by an experienced analyst providing excellent agreement with in situ measures in the ascending (r=0.98) and good agreement in the descending aorta (r=0.83). All animal manipulations and procedures were performed according to the guidelines of state and federal laws, the US Department of Health and Human Services, and the Animal Care and Use Committee of Wake Forest University School of Medicine.
2.3. Subclinical CVD Measures
Arterial calcification was measured using the same chest and abdomen CT images used for aortic area measurement. Coronary artery calcification (CAC) was measured from chest CT from the carina through the entire inferior aspect (diaphragmatic) of the heart. Whereas abdominal aortic calcification (AAC) was measured from L3 to S1 from the abdominal CT images. These images were scored for calcification presence (yes/no), as well as for severity using the Agatston method [16] by the Carr laboratory at Vanderbilt University Medical Center. Common carotid artery images were obtained using B-mode ultrasonography from a portable ultrasound machine (Cypress, Siemens/Acuson, Munich, Germany). Two images, each of the left and right, near and far walls of the distal common carotid artery (1 cm proximal to the carotid bulb), were collected and sent to the University of Pittsburgh Ultrasound Research Laboratory (URL), where they were read using a semi-automated, edge-detection reading system (Dr. Gustavsson, Sweden). These images produced measures of carotid intima-media thickness (cIMT; mm), carotid inter-adventitial diameter (IAD; mm), and carotid plaque presence (yes/no). Using an automated waveform analyzer (Colin VP2000, Komaki, Japan), brachial-ankle pulse-wave velocity (PWV; cm/s) was measured by recording pulse volume waveforms via cuffs equipped with plethysmographic sensors placed over the brachial and tibial arterial sites. baPWV is the distance in centimeters between the brachial and ankle arterial recording sites divided by the time delay in seconds between the foot of the respective waveforms. The distance or path length for brachial/ankle arterial sites was calculated based on a height-based algorithm [17].
2.4. Other Data Sources
Blood pressure readings were taken three times using an automated blood pressure cuff (Omron Healthcare, Inc, Vernon Hills, IL, USA) while the participant was sitting and with 5 min of rest in between the measurements. The average of the 2nd and 3rd readings was used as the mean systolic and diastolic blood pressure (SBP and DBP, respectively). Hypertension was defined using the American College of Cardiology (ACC) 2017 guidelines [18] as SBP ≥130 mmHg, DBP ≥80 mmHg, or current use of antihypertension medication. Standing height was measured twice using a wall-mounted stadiometer and averaged to the nearest 0.1 cm. Weight was measured to the nearest 0.1 kg using a balance beam scale. Body mass index (BMI) was calculated as the ratio of weight to height squared (kg/m2). Diabetes was defined using fasting serum glucose levels (≥126 mg/dl) and/or diabetic medication use. Dyslipidemia was defined by statin or other lipid-lowering medication use. The history of cardiovascular disease was self-reported and included myocardial infarction, stroke, congestive heart failure, angina, rheumatic heart disease, or intermittent claudication.
Standardized interviewer-administered questionnaires were used to collect demographic, health history, family history, and lifestyle information. Smoking was defined as current, former, or never smokers. Former smokers were defined as men who had previously smoked >100 cigarettes, but were not currently smoking. Regular alcohol consumption was defined for this study as drinking ≥4 drinks/week over the previous 12 months because alcohol intake is generally very low in the THS. As activity was difficult to quantify in this cohort using standard questionnaires developed in the US, we have assessed a number of metrics and determined sedentary behavior to be the strongest correlate of cardiometabolic health [19]. Therefore, sedentary behavior was dichotomized at the median into greater vs. lesser using reported TV watched per week (median=14 h).
2.5. Statistical Analysis
We examined the distribution of each aortic area and subclinical CVD variable for normality and outliers, and transformed as necessary. In order to account for the largest contributors to arterial size, all analyses were adjusted for age and height. Spearman correlation was used to determine the correlation between aortic area measures. We used age- and height-adjusted linear regression to determine the effect of a 1SD greater or presence of each CVD risk factor on each aortic area. Then, stepwise linear regression was used to determine the CVD risk factors (independent variables) with independent associations with each aortic area (dependent variables). Stepwise regressions forced the age and height to be included in each model, and required a p-value of 0.2 to enter into the model and a p-value of 0.05 to remain in the model. We used model R-square and assessed variation inflation factors to consider related CVD risk factors, including weight vs. BMI, and SBP, DBP and hypertension treatment vs. hypertension status.
To assess the predictive associations of aortic areas (independent variables) with subclinical CVD measures (dependent variables), we used multiple linear or logistic regression, as appropriate. These models were first adjusted for only the CVD risk factors determined to have an independent association with aortic areas in the stepwise modeling procedures (multivariable model), and then additionally adjusted for all measured CVD risk factors (full model). Sensitivity analyses for these results were also conducted in the subset of individuals who did not report a history of CVD (n=385).
Lastly, in order to determine the potential utility of aortic area measures taken only from chest CT, we identified individuals in the top quartile of each of the ascending and descending aortic areas and categorized them into 4 groups: 1) individuals not in the either top quartile (reference group for all analyses, n=262); 2) individuals in the top quartile of the ascending aortic area only (n=45); 3) individuals in the top quartile of the descending aortic area only (n=43); and 4) individuals in the top quartile of both the ascending and descending aortic areas (n=59). Then we used nominal logistic regression to determine the association of being in any of these large aorta groups with the odds of having each subclinical CVD adjusting for all measured CVD risk factors (full model). Having subclinical CVD was defined by either the presence of plaques (for CAC, AAC, and carotid plaque) or by being in the top quartile of continuous subclinical CVD measures (for CAC and AAC severity, cIMT and IAD, and PWV). All analyses were performed using SAS version 9.3 (SAS Institute, Cary, NC, USA).
3. RESULTS
3.1. Characteristics of the THS
Men were aged 64 years on average, with a range of 50-89 years. They were slightly overweight, and 80% were hypertensive. The prevalence of other cardiometabolic diseases was 25% for diabetes and 15% for dyslipidemia, but only 6% of men reported having a history of any CVD event. Few men were current smokers (7%) or more than occasional alcohol drinkers (14%), though over half of men reported watching more than 14 h of TV per week. Atherosclerotic plaque was present in 60% (AAC), 30% (CAC) and 15% (carotid plaque) of men. Assuming an Agatston score of 300 as significant, arterial calcifications were generally not severe (median scores: AAC 106 and CAC 0). PWV was 1655 cm/s on average. Mean unadjusted aortic areas were 10.1 cm2, 6.2 cm2, and 3.3 cm2, for the ASC, DSC, and ABD aortic locations, respectively. All aortic areas were significantly correlated with each other (all p<0.001), with Spearman correlation estimates adjusted for age and height being highest for DSC and ABD (0.61) and ASC and DSC (0.60), and lower for ASC and ABD (0.34; data not shown) (Table 1).
| Mean±SD or % | |
|---|---|
| CVD Risk Factors | |
| Age | 63.7±8.5 |
| Height (cm) | 175.2±6.8 |
| Weight (kg) | 85.1±14.8 |
| Body Mass Index (BMI; kg/m2) | 27.7±4.3 |
| Systolic Blood Pressure (SBP; mmHg) | 143.2±22.4 |
| Diastolic Blood Pressure (DBP; mmHg) | 79.7±12.1 |
| Hypertension (%) | 79.5 |
| Hypertension treatment (%) | 44.7 |
| Diabetes (%) | 24.5 |
| Dyslipidemia (%) | 14.7 |
| History of CVD (%) | 5.7 |
| ≥4 drinks/week (%) | 14.2 |
| Current smoking (%) | 6.6 |
| Former smoking (%) | 20.5 |
| Watch >14h TV/week (%) | 51.2 |
| Subclinical CVD Measures | |
| Any Coronary Artery Calcification (CAC; %) | 30.1 |
| Any Abdominal Aortic Calcification (AAC; %) | 62.1 |
| CAC Score (Agatston)* | 0(0-34.3) |
| AAC Score (Agatston)* | 105.9(0-674.2) |
| Carotid Plaque (%) | 14.9 |
| Carotid Intima-media Thickness (cIMT; mm) | 0.88±0.15 |
| Carotid Interadventitial Diameter (cIAD; mm) | 7.93±0.85 |
| Pulse-wave Velocity (PWV; cm/s) | 1655±357 |
| Aortic Areas | |
| Ascending (ASC; mm2) | 10.2±2.3 |
| Descending (DSC; mm2) | 6.2±1.2 |
| Abdominal (ABD; mm2) | 3.3±0.7 |
3.2. Association of CVD Risk Factors with Aortic Areas (Table 2)
Greater age, taller height, greater weight or BMI, greater DBP, hypertension, and hypertension treatment were all associated with larger areas at each measured aortic location (all p<0.05). Additionally, greater SBP was individually associated with DSC (p-value <0.001). However, no other traditional CVD risk factors listed in Table 2 were associated with any aortic area at p<0.05 after adjustment for age and height. Independent correlates for ASC included age, height, BMI, SBP, DBP, and hypertension treatment. For DSC, independent correlates included age, height, BMI, and DBP. While only age, height, and BMI were independent correlates of ABD.
| Unit | ASC | DSC | ABD | |
|---|---|---|---|---|
| Age (years)* | 8.5 | 0.432 # [0.001] | 0.241 # [0.001] | 0.160 # [0.001] |
| Height (cm)* | 6.8 | 0.322 # [0.005] | 0.132 # [0.026] | 0.125 # [0.001] |
| Weight (kg) | 14.8 | 0.515 [0.001] | 0.558 [0.001] | 0.230 [0.001] |
| Body Mass Index (BMI; kg/m2) | 4.3 | 0.468 # [0.001] | 0.500 # [0.001] | 0.205 # [0.001] |
| Systolic Blood Pressure (SBP; mmHg) | 22.4 | 0.174# [0.077] | 0.202 [0.001] | 0.033 [0.166] |
| Diastolic Blood Pressure (DBP; mmHg) | 12.1 | 0.508 # [0.001] | 0.317 # [0.001] | 0.087 [0.002] |
| Hypertension (%) | 1 | 0.792 [0.002] | 0.537 [0.001] | 0.164 [0.014] |
| Hypertension treatment (%) | 1 | 0.799 # [0.001] | 0.548 [0.001] | 0.199 [0.005] |
| Diabetes (%) | 1 | 0.354 [0.169] | 0.147 [0.299] | 0.090 [0.170] |
| Dyslipidemia (%) | 1 | 0.548 [0.100] | 0.235 [0.207] | 0.125 [0.297] |
| History of CVD (%) | 1 | -0.206 [0.750] | 0.109 [0.541] | 0.186 [0.360] |
| ≥4 drinks/week (%) | 1 | 0.552 [0.099] | 0.156 [0.283] | 0.153 [0.107] |
| Current smoking (%) | 1 | 0.010 [0.898] | -0.164 [0.596] | 0.001 [0.785] |
| Former smoking (%) | 1 | 0.086 [0.492] | 0.120 [0.295] | -0.028 [0.989] |
| Watch >14h TV/week (%) | 1 | 0.078 [0.534] | 0.184 [0.150] | 0.009 [0.813] |
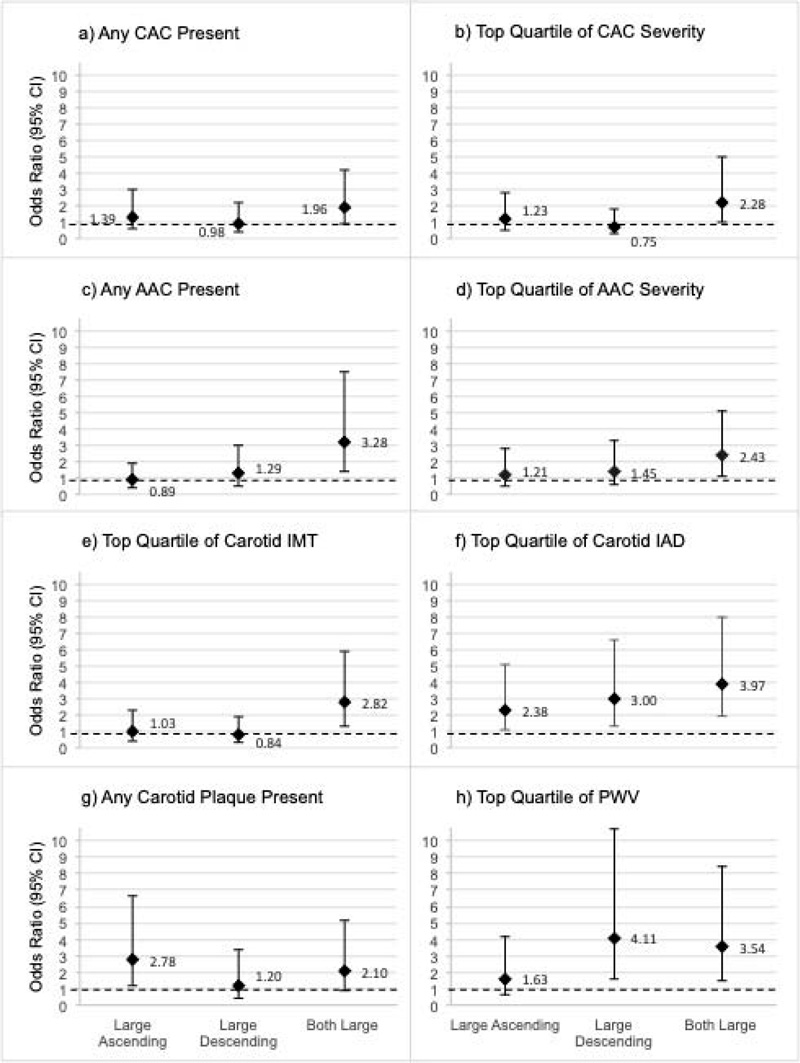
Men were categorized into four groups based on the chest CT aortic areas as being in the top quartile of the ASC only (n=45), the DSC only (n=43), both aortic areas (n=59), or neither (n=262; referent group). Odds ratio estimates are displayed (diamond marker) and 95% CI (error bars) is shown for subclinical CVD in each panel (a-h) by each large aortic area group compared to the group with neither aortic area in the top quartile. Referent group estimates (all OR = 1.0) are not shown, though the OR=1.0 threshold is highlighted via a dashed line.
| Ascending (ASC) | Descending (DSC) | Abdominal (ABD) | ||||
|---|---|---|---|---|---|---|
| MV* | Full* | MV* | Full* | MV* | Full* | |
| Logistic Regression | ||||||
| Any Coronary Artery Calcification (CAC; %) | 1.12 [0.367] | 1.16 [0.280] | 0.95 [0.675] | 0.94 [0.633] | 0.97 [0.829] | 0.99 [0.917] |
| Any Abdominal Aortic Calcification (AAC; %) | 1.07 [0.570] | 1.06 [0.684] | 1.26 [0.093] | 1.22 [0.166] | 2.13 [0.001] | 2.23 [0.001] |
| Carotid plaque (%) | 1.31 [0.063] | 1.30 [0.084] | 1.00 [0.987] | 1.00 [0.982] | 1.14 [0.351] | 1.15 [0.350] |
| Linear Regression | ||||||
| CAC Score (Agatston) | 17.9 [0.156] | 12.7 [0.157] | -30.7 [0.584] | -31.6 [0.518] | -12.7 [0.942] | -16.1 [0.986] |
| AAC Score (Agatston) | 106.7 [0.326] | 89.5 [0.469] | 95.5 [0.163] | 79.3 [0.236] | 345.8 [0.001] | 344.0 [0.001] |
| Carotid Intima-media Thickness (cIMT; mm) | 0.02 [0.011] | 0.02 [0.007] | 0.01 [0.086] | 0.01 [0.059] | 0.01 [0.442] | 0.01 [0.378] |
| Carotid Interadventitial Diameter (cIAD; mm) | 0.30 [0.001] | 0.30 [0.001] | 0.23 [0.001] | 0.23 [0.001] | 0.18 [0.001] | 0.18 [0.001] |
| Pulse-wave Velocity (PWV; cm/s) | 32 [0.018] | 28 [0.028] | 65 [0.001] | 72 [0.001] | 56 [0.001] | 53 [0.001] |
Why are the refs listed again?
3.3. Association of Aortic Areas with Subclinical CVD
After adjustment for independent correlates of aortic areas from Table 2, each of the larger aortic areas at all three locations was associated with greater carotid IAD (all p<0.001) and greater PWV (all p<0.02). When entering all three measures into a single model, no individual aortic area was an independent correlate of IAD; however, DSC was the only independent correlate of PWV (p=0.006; data not shown). In addition, greater ASC was associated with greater cIMT (p=0.011) and nominally associated with carotid plaque presence (p=0.06). Greater ABD was associated with both the presence and severity of AAC (both p<0.001). However, no aortic area was associated with CAC presence or severity. Results were largely similar after adjustment for all measured CVD risk factors (Table 3) and in the subset of men without a history of clinical CVD (n=385; Supplemental Table).
3.4. Association of Chest CT Measured Aortic Areas with Subclinical CVD
After categorizing men into large vs. not large chest aortic areas (ASC and DSC) based on being in the top quartile for either or both, we determined the association of being in these categories with subclinical CVD throughout the body adjusting for all measured CVD risk factors (Fig. 1). While all groups had greater odds of large carotid IAD, only men with large ASC had significantly greater odds of carotid plaque (OR: 2.78, 95% CI: 1.16-6.66), and only men with both large ASC and DSC had greater odds of a thick cIMT (OR: 2.82, 95% CI: 1.36-5.88). Odds of a high PWV were highest in men with only a large DSC (OR: 4.11, 95% CI: 1.58-10.70); men with both large ASC and DSC also had significantly greater odds of high PWV (OR: 3.54, 95% CI: 1.48-8.47). Interestingly, while no chest aortic area was individually associated with CAC or AAC, men with both large ASC and DSC had significantly higher odds of any AAC and of severe CAC and AAC (all p<0.04). Results were similar, and interpretations were unchanged after including adjustment for CAC in all models (data not shown), suggesting information gained from aortic size on chest CT is independent of coronary calcification.
4. DISCUSSION
In this study, we measured the aortic area at three points along the length of the artery: the ascending aorta, the descending thoracic aorta, and the lower abdominal aorta. As expected, these measures were in correlation with each other, and were also associated with greater carotid diameter, a known indicator of outward arterial remodeling [4, 7, 20, 21]. Similar to other reports [8, 9, 22], all aortic areas were larger with older age, greater body weight, obesity, and higher blood pressures, and were larger in hypertensives vs. non-hypertensives. However, no other traditional cardiovascular risk factors, such as dyslipidemia, smoking, alcohol intake, activity level, or diabetes, were associated with the aortic area. Nonetheless, the aortic area appeared to be a novel correlate of subclinical CVD elsewhere in the body, including cIMT and plaque, abdominal aortic calcification, and arterial stiffness. While the ascending and descending aortic areas were captured from chest CTs used to assess CAC, the information they provided appeared to be largely unassociated with CAC presence or severity.
Thoracic and abdominal aortic diameter reference values have been reported for the Framingham Heart Study [22] and others [23-26] using alternative measurement protocols [22]. However, this is the first study to measure aortic size at multiple locations and to assess their independent associations with CVD risk factors and subclinical measures of CVD throughout the body. A number of previous studies have measured the proximal ascending aortic diameter in relation to aneurysm risk [8-13] and other CVD [27-31]. These studies, which were either conducted in hypertensives or patients with aortic aneurysm, found an inverse association between proximal aortic size and arterial stiffness that was considered by the authors to suggest a mismatch in hemodynamic forces. In contrast, in this population-based cohort of African Caribbean men, we found a positive association between greater ascending, i.e., the proximal aorta, aortic size and greater PWV after adjustment for CVD risk factors. In fact, all aortic areas showed significant positive associations with arterial stiffness, and when taken together, the descending aortic location was the strongest and only independent correlate of arterial stiffness. The measure of PWV used in this study, brachial ankle PWV, is a mixed measure of arterial stiffness as it is derived from not only the central arteries (i.e., as carotid femoral PWV does), but the peripheral arteries as well [32]. However, brachial ankle PWV has been shown to be a rigorous marker of arterial stiffness throughout the vasculature and is highly correlated with other measures of central and peripheral PWV [33-35]. This suggests that assessment of aortic size in the descending thoracic segment rather than the proximal segment may serve as an early indicator of adverse arterial remodeling in asymptomatic individuals.
Our data suggest that the proximal ascending aorta is associated with measures of subclinical atherosclerosis elsewhere in the body, including cIMT and plaque, even independent of traditional CVD risk factors. Whereas the abdominal aorta is associated with subclinical markers of arterial aging, such as abdominal aortic calcification. It should be noted that the aortic area was measured in the same CT scan slices as aortic calcification, so there does not appear to be a great clinical utility for this measure. The ability to infer correlated subclinical atherosclerotic burden throughout the body from a cardiac CT that was ordered for another purpose (i.e., CAC measurement) may be clinically valuable. Importantly, all findings were largely similar in the subset of men without any history of CVD events, who would be the target population for early subclinical CVD risk screening. Since African ancestry individuals are at particularly high risk for subclinical and clinical vascular disease related to high blood pressure vs. atherosclerotic lipid deposition [36], it is important to evaluate novel indicators of subclinical hemodynamic disease in this population segment. However, additional studies are needed to determine if these findings are unique to this cohort, or are generally applicable across ethnicities and sex.
As aortic size throughout the thoracic cavity is captured incidentally during clinical cardiac CT imaging studies, it is possible that regular measurement and tracking of this size as an indicator of subclinical CVD could be used for future CVD event risk stratification. To that end, in Fig. (1), we demonstrate the hypothetical ability to discern individuals with subclinical CVD throughout the body by combined assessment of the ascending and descending thoracic aorta alone. From these analyses, even after adjusting for traditional cardiovascular risk factors, including age and body size, individuals with large ascending and descending aortic areas had greater odds of aortic calcification, carotid atherosclerosis, and arterial stiffness. However, these are hypothetical findings, and traditional risk stratification and clinical interpretation studies are needed.
Even though the cardiac CTs were initially gathered to assess CAC, the aortic area was not associated with CAC, and the associations between aortic areas and other subclinical CVDs were independent of CAC presence or severity in this cohort. This anatomic specificity is likely related to the functional similarities between arteries; specifically, the aorta is more similar in function and structure to the carotid and other systemic arteries tasked with transporting oxygenated blood throughout the body, compared to the focused purpose of the coronary artery, which is to deliver oxygenated blood to the cardiac muscle [37]. However, another recent study in a European population-based cohort suggested an association between a very high CAC score and a larger aortic size [31]. This may suggest population specificity to the associations; nonetheless, these data provide a theoretical framework that it may be possible to assess whole-body subclinical CVD burden from a single cardiac CT in individuals who are at high risk for incident CVD, e.g., populations with a high burden of hypertension.
CONCLUSION
In this study, we have developed a novel method for the measurement of aortic area across the length of the artery from archived CT images. We found that not only were these measurements in correlation with each other and with other arterial sizes, they were associated with aging, high blood pressure, and greater body size, as other studies performed in White participants have reported [8, 22]. Notably, this is the first study to measure the aortic size in conjunction with other indices of subclinical CVD, and we demonstrate that aortic area is independently correlated with a variety of subclinical disease measures throughout the body. Of course, further studies are needed to optimize the protocol for aortic measurement from CT as standardization has been shown to be important in reading CT aortic dimensions [38, 39], especially as a number of artificial intelligence methods for reading clinical imaging scans are under development [40, 41]. Additionally, studies are needed to extend these findings in additional ethnicities and women, and to longitudinally assess the ability of the aortic area to predict future cardiovascular events. While there is, of course, some risk associated with CT scanning, primarily from radiation exposure [42], the risk is minimal, and we propose that further studies should be conducted to determine if simply measuring the descending aortic area, in addition to the regularly measured proximal aortic area, on clinically indicated cardiac CTs may have additional utility for clinical interpretation and risk stratification as has recently been suggested in aneurysm screening [43] and coronary angiography [44] populations.
ETHICS APPROVAL AND CONSENT TO PARTICIPATE
The Institutional Review Boards of the University of Pittsburgh and the Tobago Ministry of Health and Social Services approved this study.
HUMAN AND ANIMAL RIGHTS
No animals were used for studies that are the basis of this research. All human procedures were in accordance with the ethical standards of the committee responsible for human experimentation (institutional and national), and with the Helsinki Declaration of 1975, as revised in 2013.
CONSENT FOR PUBLICATION
All participants provided written informed consent.
AVAILABILITY OF DATA AND MATERIALS
Not applicable.
FUNDING
The authors would like to thank all supporting staff from the Tobago Health Study Office, the Vanderbilt University Computed Tomography Lab, and the University of Pittsburgh Ultrasound Research Lab. This work was supported by grants K01-HL125658 and R03-HL144668 (PI: Kuipers) from the National Heart, Lung and Blood Institute, and by grant R01-DK097084 (PI: Miljkovic) from the National Institute of Diabetes and Digestive and Kidney Diseases.
CONFLICT OF INTEREST
The authors declare no conflict of interest, financial or otherwise.
ACKNOWLEDGEMENTS
Declared none.
SUPPLEMENTARY MATERIAL
Supplementary material is available on the publisher’s website along with the published article.