All published articles of this journal are available on ScienceDirect.
Pulse Wave Analysis by Applanation Tonometry for the Measurement of Arterial Stiffness
Abstract
The aim of our study was to investigate the association between pulse wave velocity (PWV) and pulse wave analysis (PWA)-derived measurements for the evaluation of arterial stiffness. A total of 20 (7 male and 13 female) healthy, non-smoking individuals, with mean age 31 ± 12years were included. PWV and PWA measurements were performed using a SphygmoCor apparatus (Atcor Medical Blood Pressure Analysis System, Sydney Australia). PWV significantly correlated with all central aortic haemodynamic parameters, especially with pulse pressure (PP) (p < 0.0001), augmentation index corrected for 75 pulses/min (AI75) (p = 0.035) and augmentation pressure (AP) (p = 0.005). Male subjects presented significantly higher PWV compared with females (p = 0.03), while there were no differences in PP, AP and AI75. In conclusion, PWA is strongly correlated with PWV as a method for the evaluation of arterial stiffness.
INTRODUCTION
In recent years, emphasis has been placed on the role of arterial stiffness in the development of cardiovascular disease [1-5]. There is a multitude of available methods, but important questions remain as to the choice of method, utility of various arterial indices and their clinical implications [1-5]. Pulse wave velocity (PWV) is generally considered the most precise way to estimate, non-invasively, arterial stiffness in humans. Indeed, a wide range of studies have shown that high PWV values are associated with increased arterial stiffness and increased risk for cardiovascular disease [1, 2, 5-7].
Pulse Wave Analysis (PWA) is another modality evaluating arterial function, which is less time consuming and technically easier than PWV [7]. Central aortic haemodynamic parameters derived by PWA include pulse pressure (PP), augmentation pressure (AP) and augmentation index (AI75), which have been reported to be reliable markers for estimating arterial stiffness [7]. In addition, AI75 and AP have been proposed as independent risk factors for atherosclerosis in patients with type 2 diabetes [8-10].
Despite the evidence supporting the reliability of both PWV and PWA, there are not enough data regarding their possible correlation with each other and with other established cardiovascular risk factors. Thus, the aim of the present study was to investigate the association between PWV and PWA-derived measurements of PP, AI75 and AP in healthy male and female individuals.
PARTICIPANTS AND METHODS
Healthy, non-smoking individuals (n = 20; 7 male and 13 female; mean age 31 ± 12 years) were included. Exclusion criteria were: blood pressure (BP) >140/90 mmHg, bradycardia (heart rate <55 beats/min), atrial fibrillation or other cardiac arrhythmias or current pregnancy. We also excluded subjects with a body-mass index (BMI) >35 kg/m2, as it would be technically difficult to access their femoral artery for the PWV measurements.
All participants provided written informed consent before entering the study, which was conducted according to the principles of the declaration of Helsinki [11]. The study was approved by the institutional review board of the Joslin Diabetes Centre. The demographic and clinical characteristics of the study participants are shown in Table 1.
| Participant Characteristics | Values |
|---|---|
| n | 20 (7 male, 13 female) |
| Age (years), mean ± SD | 31±12 |
| Systolic blood Pressure (mmHg), mean ± SD | 115±13 |
| Diastolic blood pressure (mmHg), mean ± SD | 72 ±7 |
| Heart Rate (beats/min), mean ± SD | 62±9 |
| Height (cm), mean ± SD | 172±9 |
| Weight (kg), mean ± SD | 75±18 |
| BMI (kg/m2), mean ± SD | 25.1±4.5 |
Measurements were performed at least 4 h after the individual’s last food consumption without further restrictions. First, a full medical history and a family history were recorded followed by the measurement of the arterial BP. Body weight and height were measured in light clothing and without shoes. Both PWV and PWA measurements were then performed using the SphygmoCor Px (Atcor Medical Blood Pressure Analysis System, Sydney Australia) in a temperature-controlled room in the Clinical Research Unit of Joslin Diabetes Centre.
PWV was evaluated between the carotid and femoral artery with the participant lying in the supine position. Pulse measurements were performed non-invasively using the SphygmoCor probe over the carotid and femoral artery while an ECG recording was performed simultaneously [12]. To ensure a stable, artefact-free ECG, the skin was properly prepared (hair removed at electrode site and skin cleaned with an alcohol wipe). A minimum of 12 sec of signal (approximately 10 heart beats) was recorded after a strong accurate and reproducible pulse wave signal was obtained.
The distance from the carotid to femoral artery was measured directly between each artery location and the supra-sternal notch and the values were entered into the SphygmoCor software database. PWV was calculated by measuring the time delay between two characteristic timing points on two pressure waveforms that were at a known distance apart. The SphygmoCor method uses the foot of the waveform as an onset point for calculating the time differences between the R wave of the ECG and the pulse waveforms at each site. PWV was automatically calculated by the Atcor software as the carotid-femoral artery distance divided by the wave travelling time between the above 2 measuring sites. PWV measurements with a standard deviation less than 10% were used for analysis [12].
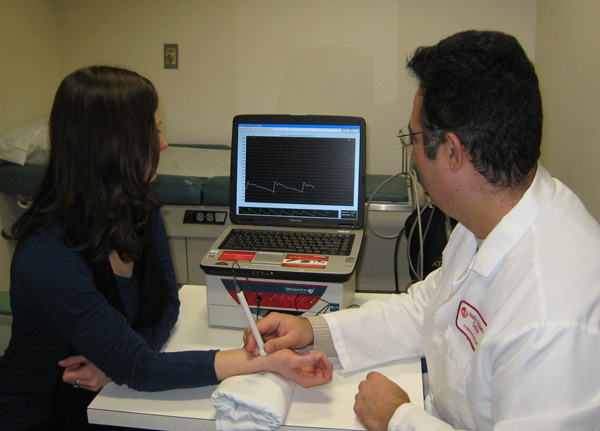
The central aortic haemodynamic parameters, AI75, AP and PP, were measured using applanation tonometry of the radial artery as previously described [13]. The radial artery pressure wave and amplitude were recorded non-invasively with a pencil-type probe over the right radial artery with the wrist slightly extended and supported on a pillow (Fig 1). Recordings were taken after a reproducible signal was obtained. Twenty sequential waveforms covering a complete respiratory cycle were required for the system software to generate an average peripheral and corresponding central waveform, which was then subjected to further analysis [13].
Two pressure peaks characterise the systolic part of the central waveform. The first peak results from the left cardiac ventricle ejection, and the second one results from the wave reflections from the periphery. The difference between these two peaks represents the degree of the central arterial pressure augmentation due to wave reflection. The AP is the absolute increase of the PP due to the reflected wave and AI75 is the measure of the contribution of the wave reflection to the arterial pressure waveform. AI75 is expressed as a percentage of the PP. The amplitude and timing of the reflected wave ultimately depends on the stiffness of the small vessels and large arteries, representing a measurement of the systemic arterial stiffness [12, 13].
The PWA calculation is influenced by factors including the heart rate and the site of the wave reflection [14]. Thus, data corrected for 75 pulses/min by an automated feature of the Atcor software were used for the analysis.

Data were analysed using the Minitab 14.0 statistical package software (Minitab, State College, Pennsylvania, USA). Normality was evaluated by the Kolmogorov-Smirnov test. As a first descriptive tool, the association between PWV and PWA parameters was graphically displayed by scatter plots. To evaluate their correlation, Pearson's Correlation Coefficients between PWV and AI75, AP or PP were calculated. The hypothesis that the correlation is significantly different from zero (no correlation) was tested by double-sided Pearson's product moment correlation tests. A p < 0.05 were considered significant.

RESULTS
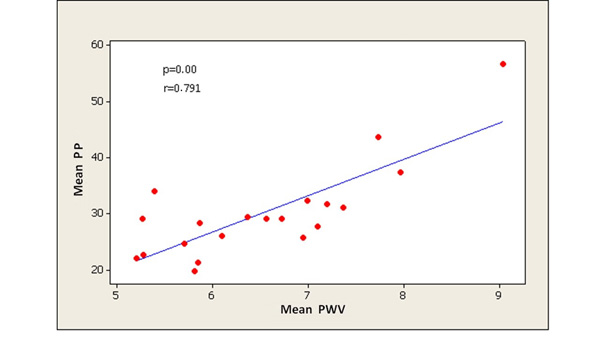
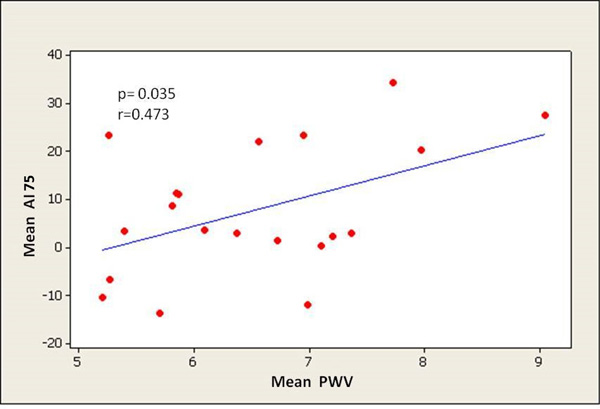
PWV significantly correlated with all central aortic haemodynamic parameters, especially with PP (PP: p < 0.0001, AI75: p = 0.035, AP: p = 0.005, respectively) (Figs. 2-4). There was a small but significant difference of PWV between male and female individuals (male 7.10 ± 1.11 m/sec; female 6.13 ± 0.80 m/sec) (p = 0.03), while there were no differences in PP, AP and AI75.


Individuals with a family history of hypertension had increased PWV (7.11±1.30 m/sec, p = 0.057) and PP (35±12 mmHg, p = 0.051), compared with those with a hypertension free family history (6.16±0.70 m/sec and 28.0±4.8 mmHg, respectively).
Family history of diabetes, hyperlipidaemia or cardiovascular disease had no significant correlation with central haemodynamic parameters or PWV (Table 2).
| Variables | PWV | AI75 | AP | PP |
|---|---|---|---|---|
| DMfh | 0.597 | 0.339 | 0.575 | 0.807 |
| CVDfh | 0.622 | 0.330 | 0.496 | 0.655 |
| HTNfh | 0.057 | 0.885 | 0.535 | 0.051 |
| LIPfh | 0.761 | 0.811 | 0.845 | 0.779 |
Heart rate was also not correlated with PWV nor with any of the PWA parameters (Table 3). Age correlated significantly with both PWV (p = 0.03) and central haemodynamics (AI75: p = 0.006, AP: p = 0.002; PP: p = 0.009, respectively) (Table 3).
| Variables | PWV | AI75 | AP | PP |
|---|---|---|---|---|
| PWV | 0.035 | 0.005 | 0.000 | |
| AI75 | 0.035 | |||
| AP | 0.005 | |||
| PP | 0.000 | |||
| Age | 0.033 | 0.006 | 0.002 | 0.009 |
| BMI | 0.003 | 0.194 | 0.153 | 0.084 |
| Weight | 0.006 | 0.658 | 0.448 | 0.100 |
| Height | 0.329 | 0.232 | 0.488 | 0.470 |
| SBP | 0.001 | 0.907 | 0.405 | 0.002 |
| DBP | 0.042 | 0.939 | 0.679 | 0.337 |
| HR | 0.443 | 0.456 | 0.479 | 0.122 |
BMI was positively related to PWV (p = 0.08) but not to AI75 and AP, and there was a trend to be correlated to PP, however, this did not reach significance (p = 0.08).
Systolic BP correlated significantly with PWV (p = 0.001) and PP (p = 0.002) while diastolic BP correlated only with PWV (p = 0.04).
DISCUSSION
The main finding of our study is that there is a significant correlation between the PWV and each of the PWA parameters as measured by applanation tonometry. The correlation reached its highest degree of significance between PWV and PP (p < 0.0001). The close relation of these two methods for the arterial stiffness measurement is consistent with other published studies [15].
As expected, age was a major determinant of arterial stiffness measured by both PWV and PWA, although the majority of the study participants were of young age. Young age was probably the reason why the family history of diabetes, cardiovascular disease and hyperlipidaemia did not show any correlation with either PWV or PWA values, as reported in other studies [16-18].
Family history of hypertension was a significant predictor of arterial stiffness, as reported in other studies [19].
Male gender was a predictor for arterial stiffness as measured by PWV, while PWA parameters did not show any differences in arterial stiffness between genders. Exploring the literature, there are inconsistent findings regarding the influence of gender on arterial stiffness as measured by PWV or PWA. In one study that evaluated PWV in young normotensive individuals (mean age: 22.3±2.1 years) with a family history of hypertension, it was reported that male gender was an independent risk factor for arterial stiffness as measured by PWV [19]. Men were reported to have stiffer arteries than women, measured by PWV, in another study in middle and old aged Chinese population (44-79 years) [20]. Similar results were reported in a larger general population study in Denmark [21]. In contrast, in a study using applanation tonometry for the measurement of arterial stiffness it was reported that female healthy individuals had increased arterial stiffness compared with healthy men [22]. Similar results were presented in another recent large study conducted in the general population in Denmark [23]. However, most of the studies were conducted in a relatively small number of participants, and arterial stiffness was evaluated with either PWV or PWA, and not with both methods.
However, we did find a significant correlation between arterial BP and arterial stiffness measured by PWV as well as with PP. This is in accordance to other published studies that support the association between arterial stiffness and BP, especially systolic BP [10, 24].
It is noteworthy that the strongest correlation among PWV and the PWA parameters proved to be between PWV and PP. Indeed, considerable evidence supports that increased PP as measured by PWA may be considered a significant risk factor for cardiovascular events, even stronger than hypertension measured by standard BP readings [25-27].
The major limitation of this study is the small number of participants. A second limitation is the absence of prospective data. Furthermore, we did not analyse the effect of therapeutic agents, which may affect arterial stiffness [28-31]. Similarly, we did not enquire into the effect of smoking [32], obesity and metabolic syndrome [33-35]. All these interesting issues were beyond the scope of the present study, which looked at PWA as a method of evaluating arterial stiffness.
CONCLUSION
In conclusion, our findings demonstrate that central aortic haemodynamic parameters, measured by PWA calculated using applanation tonometry of the radial artery, are closely correlated to the PWV measurements, which are considered to be the gold standard for the non-invasive evaluation of arterial stiffness in males and females.
CONFLICT OF INTEREST
The authors confirm that this article content has no conflict of interest.
ACKNOWLEDGEMENTS
The study has been funded by the Joslin Diabetes Centre.


