All published articles of this journal are available on ScienceDirect.
Body Surface Mapping of T-wave Alternans Depends on the Distribution of Myocardial Scarring
Abstract
T-Wave alternans (TWA) testing using 12-lead electrocardiogram/Frank leads is emerging as an important non-invasive biomarker to identify patients at high risk of Sudden Cardiac Death (SCD). Cardiac scarring is very common among cardiomyopathy patients; however, its influence on the body surface distribution of TWA has not yet been defined. Our objective was to perform a simulation study in order to determine whether cardiac scarring affects the distribution of TWA on thorax such that the standard leads fail to detect TWA in some of cardiomyopathy patients; thereby producing a false-negative test. Developing such a novel lead configuration could improve TWA quantification and potentially optimize electrocardiogram (ECG) lead configuration and risk stratification of SCD in cardiomyopathy patients. The simulation was performed in a 1500-node heart model using ECGSIM. TWA was mimicked by simulating action potential duration alternans in the ventricles. Cardiac scarring with different sizes were simulated by manipulating the apparent velocity, transmembrane potential and transition zone at varied locations along the left ventricular posterior wall. Our simulation study showed that the location of maximum TWA depends on the location and size of the myocardium scarring in patients with cardiomyopathy, which can give rise to false-negative TWA signal detection using standard clinical leads. The TWA amplitude generally increased with the increment of scar size (P<0.00001). We found one specific location (a non-standard lead) that consistently appeared as the top five maximum TWA leads and could be considered as an additional lead to improve the outcome of the TWA testing in cardiomyopathy patients.
I. INTRODUCTION
Sudden Cardiac Death (SCD) is the cause of approximately 325,000 adult deaths each year in the U.S. [1]. People identified with a high likelihood of SCD have the choice of having an Implantable Cardioverter Defibrillator (ICD) embedded. The ICD is implanted in either the chest or abdomen of the patient with leads connecting to the heart chambers. This connection allows the ICD to monitor the heart rhythm. If the ICD detects an irregular rhythm, it has the ability to provide an electric shock of high-energy pulses to the patient’s heart to restore sinus rhythm and save the patient’s life. However, identifying those patients at risk of SCD remains a formidable challenge, as many people are asymptomatic until the event, and a majority do not survive the first episode. In order to successfully prevent SCD, it is important to identify patients at high risk of SCD, and those who will benefit most from expensive ICD therapy. One way to identify these patients is to stimulate the heart directly with a catheter electrode to determine the arrhythmo-genicity of the heart. However, this method is invasive and could cause further complications for patients.
A non-invasive method proposed in literature is the assessment of T-wave alternans (TWA) in the electrocardiogram (ECG). Body surface TWA, also called repolarization or invisible alternans, arises from beat-to-beat action potential alternans, and can presage ventricular tachyarrhythmias by increasing repolarization dispersion with subsequent conduction block and reentry [2]. In patients with moderate to severe left ventricular dysfunction, TWA magnitude measured from Holter recordings and ICD electrograms increases before ventricular tachyarrhythmias and could be used to prevent SCD from happening [3, 4].
Clinically, the lead configuration being used for TWA evaluation consists of the standard 12 leads/Frank leads [5] during exercise test or 2-3 bipolar leads during ambulatory recordings [6]. Because TWA is on the order of microvolts, computer-based techniques are required to detect the invisible TWAs from the ECG. Therefore, the accuracy of TWA measurement depends on the TWA detection algorithm being used, and also on the location of the recording electrodes on the subject’s chest.
Several prospective clinical studies have consistently shown a high negative predictive value (97% /year) for sudden cardiac death with TWA testing [7]. However, the more recent MASTER [8] and SCD-HeFT TWA substudy [9] found no difference in adverse clinical events between positive vs. negative TWA patients, and a lower negative predictive accuracy of 93% /year. Cardiac scarring is very common among cardiomyopathy patients. It has been shown that scarring of heart muscle is highly associated with increased risk of SCD [10]. However, the influence of scarring on the magnitude and spatial TWA distribution on body surface potentials and whether the clinical lead configuration is suitable for TWA detection in cardiomyopathy patients has not been studied. We hypothesized that the size and location of the myocardial scarring in cardiomyopathy patients may alter the body surface distribution of TWA in some patients, such that the standard clinical lead configuration fail to detect TWA; thereby producing a false negative test.
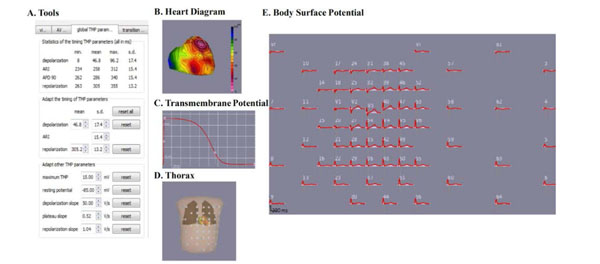
The ECGSIM GUI consists of five sections: A. the ECGSIM toolbox, B. the heart diagram, C. the TMP diagram, D. the leads diagram on thorax, and E. the body surface potential.
Our objective was to determine how scarring of heart muscle affects the distribution of the maximum TWA (TWAmax) on the thorax. The long-term goal is to optimize the ECG lead configurations to improve the outcome of TWA testing and SCD risk detection in cardiomyopathy patients. In an attempt to find an optimum lead placement for accurate TWA measurement, some prior limited studies have investigated the magnitude distribution of TWA on the body surface [11, 12]. In [11], Selvaraj et al., model the TWA as the action potential duration alternans (APDA) along the myocardium and simulate its body surface projection using a forward solution provided by ECGSIM [13]. Based on this analysis, the authors propose a modified lead configuration in the precordial area which consistently locates maximum TWA; and thereby improves TWA quantification. In another study [12], Janusek et al., simulate the mechanism of TWA generation in ECG signals on the surface of the body and compare it to the action potential pattern of ventricular heart cells. The authors use ECGSIM for the analysis and show that the standard 12 lead ECG system cannot detect TWA for every patient. In a study from our group [14], we showed that TWA maximum is not prevalent in standard leads, and shifts across the body torso with increasing heart rates. Although the body surface distribution of maximum TWA has been investigated as explained above, the effect of cardiac scarring on the magnitude and spatial distribution of TWA across the entire thorax has not been studied.
The organization of this paper is as follows: details of the methods used to simulate TWA and cardiac scarring is outlined in Section II. The results are provided in Section III and discussed in Section IV.
II. MATERIALS AND METHODS
This section provides a brief introduction to ECGSIM and describes the process for simulating TWA and cardiac scarring using ECGSIM.
A. ECGSIM
ECGSIM is an interactive simulation program that provides a forward solution to the study of electrical activity of the heart and the resulting potentials on the thorax. ECGSIM has been used as a research tool for the manifestation and analysis of cardiac malfunctioning in the ECG wave forms on the thorax. The source is modeled using ventricular myocyte transmembrane action potentials assigned to 1,500 nodes on the epicardium and endocardium. Unipolar potentials at 300 positions on the body surface are computed using a transfer matrix based on tissue conductivity and heart and thorax geometry from human magnetic resonance imaging [15]. All simulated ECG signals were taken on a Body Surface Map (BSM) with 64 electrodes as seen in the lead diagram (see Fig. 1). The heart diagram is where nodes can be chosen for any desired manipulation. Repolarization and depolarization time can be manipulated in the panel (Tools) to model the action potential. In the transmembrane potential (TMP) diagram, the TMP amplitude can be altered interactively to change the transmembrane amplitude at any given node. Also within the heart diagram is where transmural, endocardium, and epicardium can be chosen for further manipulation.
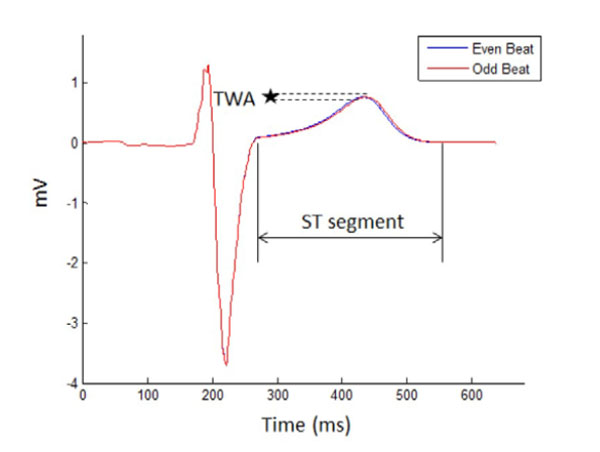
Two consecutive ECG signals are denoted as even and odd beats. The T wave alternates in shape from the even beat to the odd beat. The microvolt change in the amplitude or shape of the T waves between the beats is a TWA.
B. Simulation of TWA Without Cardiac Scarring
TWA is defined as the alternation in either the amplitude or shape of the T wave in the every other beat of the ECG (see Fig. 2). In this diagram, TWA is measured as the difference between 2 consecutive beats that are labeled as either an even or an odd beat. As described in clinical medicine a TWA of greater than 1.9 microvolts is used to identify a high-risk patient [16]. TWA were simulated using ECGSIM by manipulating APDA and then calculated using MATLAB.
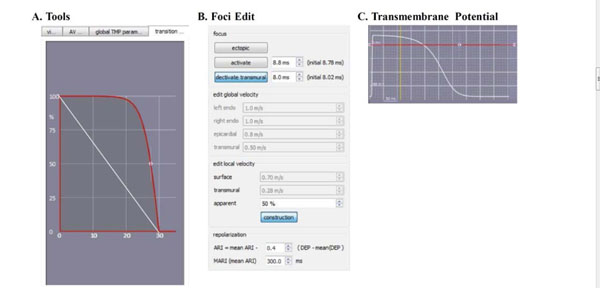
The changes that are made in the ECGSIM GUI to simulate scar in the left ventricular posterior wall are shown here. (A). The parabolic transition zone in the toolbox. (B). The apparent velocity is decreased to 50%. (C). The TMP amplitude is decreased to a linear 0mV.
TWA was mimicked using action potential duration alternans. As shown in previous studies, TWA originates from action APDA at the myocyte level [17-19]. Using this concept, Selvaraj et al. [11], modeled three different patterns of APDA in the heart: global, regional and discordant. In the present paper, we employ the same concept to simulate TWA. These three types were simulated by manipulating the repolarization time to attain an APDA of 4 ms in two consecutive beats. This repolarization time is selected based on a previous study [11] and corresponds to the APDA magnitude in heart failure patients. In global APDA, an alternan of 4 ms was generated in all nodes on the heart (i.e., both left and right ventricles). Regional APDA is simulated as an alternan of 4 ms left ventricle. Discordant APDA is simulated as an alternan of 4 ms by shortening in left ventricle, while is lengthened in right ventricle.
C. Simulation of TWA with Cardiac Scarring
In order to study alternans in the presence of myocyte scars, cardiac scarring is introduced and then TWA simulation is performed as explained above. Once the location of the scar is selected by clicking at the desired location on the heart diagram, cardiac scarring can be modeled by manipulating the apparent velocity, TMP amplitude, and transition zone as follows.
• The apparent velocity was changed on the foci edit tab from 100 percent to 50% at the site of the scar (see Fig. 3B) [20].
• The TMP amplitude was decreased to 0 mV on the transmembrane potential tap (red line in Fig. 3C).
• The transition zone is manipulated from linear to parabolic on the transition zone tab (red curve in Fig. 3A) [21-23]. As can be seen in this figure, the scar size can be adjusted to vary from 0 mm to 30 mm (the horizontal axis in Fig. 3A).
In this experiment, we simulated two different transmural scar sizes: small (i.e., 10 mm) and large (i.e., 30 mm) at two different locations along the left ventricular posterior wall.
D. TWA Measurement
Once TWA simulations are performed in ECGSIM, the data is imported into MATLAB for analysis. For each of the 64 leads in the BSM, TWA in consecutive beats is determined along the ST segment as half of the mean absolute difference in the amplitude using the following equation.
 (1)
(1)
where ST1 and ST2 are even and odd beats, respectively and N is the sample duration of the ST segment.
III. RESULTS
A set of experiments were performed to investigate the effect of scarred myocyte on the amplitude and distribution of TWAmax across the thorax including at the standard leads.
A. Effect of APDA type on TWAmax at Standard Leads
Three different types of APDA are simulated: global, regional, and discordant as explained in Section II-B. Eqn. 1 is used to calculate TWA amplitude at the standard leads V1 to V6. The maximum TWA amplitude and the corresponding location is identified and reported in Table 1. TWA amplitude varied depending on the type of APDA; however, the TWAmax remained similar for all three APDA types. Global and regional APDA had the largest TWAmax, while discordant APDA consistently had the smallest TWAmax . The TWAmax was located at V3, regardless of whether APDA was global, regional or discordant.
B. Effect of Myocardium Scarring on TWAmax at Standard Leads
The myocardium scarring was created at two different sizes and locations on the left ventricle. As can be seen in Fig. (4), the size of the scar varied from small (10 mm) to large (30 mm) and two different locations on the left ventricular posterior wall were chosen to place scars. Fig. (5) shows 2 consecutive beats and the corresponding TWA amplitude for a small and large myocardium scarring. As can be seen, the myocardium scarring has changed the TWA amplitude. A summary of the TWAmax amplitude and location in relation to APDA type, and size and location of the myocardium scar is listed in Table 2.

The top left heart is a normal heart with no manipulations. Below is the heart geometry used in ECGSIM with 1500 nodes. To the right are more heart images and these show the two different left ventricular scarring locations and the size difference between a small and a large scar.
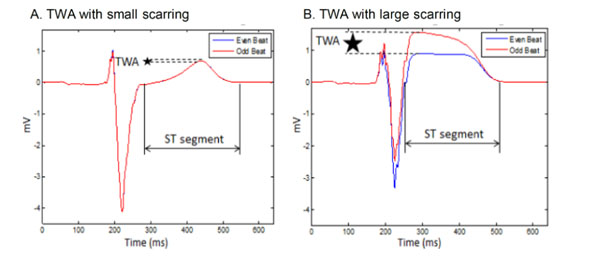
Two consecutive ECG beats with (A) small cardiac scarring and (B) large cardiac scarring.
With scarring, the TWA magnitude was generally increased (Table 1 and 2). The small scar resulted in a TWAmax larger than the TWAmax without scarring for global and regional types of APDA. In the case of discordant APDA, the TWAmax decreased for small scar at both locations. In case of large myocardium scarring, TWAmax increased independent of the APDA type.
| APDA Type | APDA Location | TWAmax (µV) | Lead |
|---|---|---|---|
| Global | Whole Heart | 9.71 | V3 |
| Regional | Left Ventricle | 9.71 | V3 |
| Discordant | LV/RV | 9.60 | V3 |
| APDA Type | Location 1 | |||
|---|---|---|---|---|
| Small Scar (10mm) | Large Scar (30mm) | |||
| TWAmax (µV) | TWAmax Lead | TWAmax (µV) | TWAmax Lead | |
| Global (Whole Heart) Regional (Right Ventricle) | 23.90 | V3 | 125.95 | V2 |
| Discordant (Left and Right Ventricle) | 131.18 | V3 | 384.64 | V2 |
| 0.17 | V3 | 358.88 | V3 | |
| APDA Type | Location 2 | |||
| Small Scar (10mm) | Large Scar (30mm) | |||
| TWAmax (µV) | TWAmax Lead | TWAmax (µV) | TWAmax Lead | |
| Global (Whole Heart) Regional (Right Ventricle) | 11.58 | V4 | 115.02 | V3 |
| Discordant (Left and Right Ventricle) | 11.58 | V4 | 499.16 | V3 |
| 0.08 | V4 | 552.69 | V3 | |
The location of TWAmax varied depending on the type of APDA, the scar size and location. As can be seen in Table 2, the maximum lead moved from V3 (at no scarring) to V2, V3 and V4 in some of the cases, with the majority remaining at V3.
C. Effect of Myocardium Scarring on TWA Amplitude on the Thorax
The TWA amplitude was calculated for each of the 64 leads in the BSM. The distribution of the TWA amplitude is plotted for different APDA types and scar locations and sizes in Fig. (6). When scarring was simulated, the TWAmax increased with the increment of scar size in global and regional APDA. The large scarring TWA is considerably bigger that the small scarring TWA. This is true in case of discordant APDA with the exception that the small myocardium scar resulted in a smaller TWA compared to the no scar case.
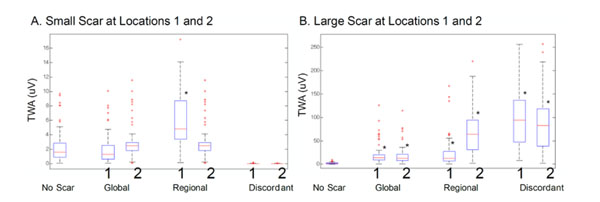
TWA magnitude on body surface mapping with (A) small cardiac scarring and (B) large cardiac scarring. The black asterisks represent a significant change vs. no-scarring TWA (P < 0.0001).
D. Effect of Myocardium scarring on TWAmax Distribution on Thorax
Scarring affected the spatial distribution of TWA. This behavior is illustrated in Fig. (7). The isoalternans plots show the magnitude and spatial distribution of TWA corresponding to global APDA for no scar, small myocardium scarring and large myocardium scarring. Here it can be seen that the magnitude of TWA increased with the scar size, and the distribution of TWA on the thorax changed. This supports the hypothesis that the body surface potential distribution changes when scarring is involved and, as a result, the TWAmax moves on the thorax.
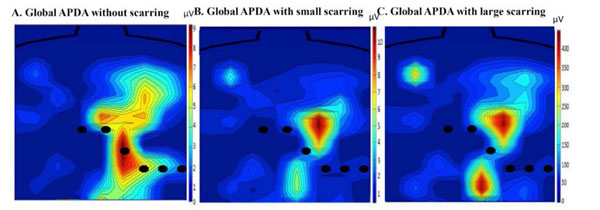
The positions of the standard leads are shown for reference. This image shows the TWA body distribution changes when scarring is created on the left ventricular wall. The maximum of TWA moves from V3 to a lead above V4, therefore showing that the maximum has moved away from the standard leads.
The location of TWAmax when there is no scarring occurs on standard electrode, V3 (Fig. 8A).
However, the TWAmax moved from this standard electrode to a different electrode on the thorax when scarring was involved (Figs. 8B and C). This movement is dependent on many factors, such as size and placement of the scar, as well as type of APDA. However, this movement consistently happens towards a non-standard electrode when scarring is involved.
To find the electrode that is the most strongly associated with TWAmax, the simulated data was compiled for all three APDA types and scar distributions. The five largest TWAmax magnitudes and corresponding electrode numbers were recorded from all simulations. The frequency of occurrence and electrode numbers are illustrated in Fig. (9A). The location of the five largest TWAmax magnitudes across the thorax is illustrated in Fig. (9B). Electrode 40 was found to be the lead most frequently associated with TWAmax (i.e., a non-standard electrode) with an occurrence rate of 32 (Fig. 9). The second most frequent was electrode V3 with an occurrence rate of 20 times. This observation supports the hypothesis that the TWA distribution varies with the location and size of the cardiac scarring in cardiomyopathy patients and TWAmax occurs more often outside the standard leads.
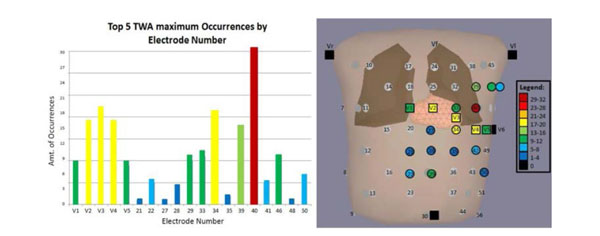
(A) The distribution of the TWAmax on the thorax. The squares are standard electrodes and the circles are non-standard electrodes. The bar color on B correlates to A. (B) The highest occurrence was 32, which happened on lead 40 (the red circle in B) and the second highest was 20 (lead V3).
IV. DISCUSSION
We have studied the effect of the size and location of myocardium scarring on the quantitative assessment of TWA. The present study is the first to model the effect of cardiac scarring on the body surface distribution of TWA. This study is built on our previous clinical study showing that TWAmax is not prevalent in standard clinical leads and shifts across the thorax with changes in the heart rate. Our major findings include: (1) in the absence of myocardium scarring TWAmax remains in standard leads regardless of the APDA mechanism used to simulate TWA, (2) myocardium scarring affects the BSM distribution of TWA irrespective of the size and location of the scar and (3) a novel lead configuration that includes our lead 40 along with the 6 standard leads can improve quantitative assessment of TWA in cardiomyopathy patients.

The black square electrodes represent the standard leads. The blue, red and green electrodes represent the maximum TWA location for each type of APDA. TWAmaxplacement on the thorax with no scarring and two different scar size and placement.
TWA Magnitude: The TWA amplitude did not vary when different types of APDA were simulated. In the case of global, regional (4 ms) and discordant (4 ms) APDA, a TWAmax of about 9.7 µV was measured, which is comparable to previous studies [11]. With cardiac scarring simulated on the LV posterior wall, TWA amplitude varied depending on the size and location of the scar as well as APDA type. In the case of global and regional APDA, TWA at standard leads and BSM increased with the size of the scar irrespective of the scar location (Table 2 and Fig. 6). This finding was consistent with TWA being a risk indicator to SCD and scarring of myocardium is highly associated with increased risk of SCD. With discordant APDA, TWA decreased in the case of small scarring and increased in the case of large scarring. The reason for such a behavior can be explained as the way that discordant TWA was implemented in this study. The TWA that was measured in the absence of any cardiac scarring is because of the discordant difference in the action potential duration between LV and RV. In the case of small scarring, there is less amount of tissue involved during the activation of the LV and this will compensate the difference in membrane potentials on opposite sides of the heart, and as a result, a very small TWA was measured on the thorax.
TWA Spatial Distribution: When there was no myocardium scarring, TWAmax consistently localized to lead V3, and standard lead, regardless of the APDA mechanism used to simulate TWA (Table 1), which is consistent with prior studies [11] as well as clinical standards for measuring TWA. However, TWA distribution was effected when scarring was introduced on the left ventricular wall. This was shown by the movement of the TWAmax away from the standard leads once scarring occurred (Fig. 7) . This movement is dependent on both the size of the scar and placement of the scar. However, TWAmax always moved to a non-standard lead (Fig. 8). As a result, using the standard clinical lead configuration, TWA magnitude might be underestimated, thereby resulting in a false negative outcome for clinical TWA testing in cardiomyopathy patients. Our simulation study showed that lead 40, which is located above V4, will consistently be among the five largest TWA irrespective of the size and location of the scarring and the APDA type, while standard leads will be among the five largest TWA leads in about 70% of the cases (Fig. 9).
Clinical Implications: In patients with cardiomyopathy, Klingenheben et al. [24] showed that arrhythmic events were associated with higher TWA signal and a greater number of TWA positive ECG leads. Although BSM of TWA is not practical for population screening for high risk of SCD, our findings highlights the potential for TWA signal underestimation with standard clinical leads in some cardiomyopathy patients, and the need to consider an expanded lead set with greater precordial sampling [11]. Hence, the main clinical implication of our findings is identification of a novel lead configuration that may improve TWA testing in screening cardiomyopathy patients compared with the standard lead configuration. This finding could potentially improve the prognostic utility of TWA testing in cardiomyopathy patients who are generally at a higher risk of ventricular tachyarrhythmias and sudden death compared to people with no cardiac scarring [7].
Limitations: The ECGSIM heart model incorporates action potential waveforms that recapitu- late the normal sequence of activation and repolarization based on an equivalent surface source model. Although the heart model does not simulate electrotonic coupling between discordantly alternating myocardial segments that may minimize differences in action potential, this is unlikely to affect the body surface QRST unipolar electrograms because the boundaries of alternating myocardium represent a relatively small proportion of the alternating myocardial mass being simulated [11]. Second, ECGSIM program solves a forward problem for one particular shape of the body, size and location of the internal organs acquired with applied MRI system. This allows for the anticipation of the TWA variation on the body surface and optimal lead selection to obtain clinically significant TWA in cardiomyopathy patients. The prognostic utility of this lead set compared with the conventional lead configuration needs to be evaluated in a future study to confirm the effects of scarring on the spatial distribution of TWA in real patients.
CONCLUSIONS
The body surface distribution of TWA is dependent on the cardiac scarring in patients with cardiomyopathy, which may cause inconsistent TWA signal detection using the standard clinical leads. As a consequence, clinical TWA test could result in false negative in cardiomyopathy patients. However, the effect is dependent on the size and placement of the scar, as well as the type of APDA used to simulate TWA. Lead 40 (located above V4) was consistently among the five largest TWA leads over the body surface potential. These novel findings have implications to support the need for a larger sampling area over the precordium to improve TWA detection signal and SCD risk stratification in cardiomyopathy patients.
CONFLICT OF INTEREST
The authors have no competing interest to declare. The authors have no sources of funding to state.
ACKNOWLEDGeMENTS
The authors would like to acknowledge Peter van Dam for providing ECGSIM, and Dr. Raja Selvaraj from Jawaharlal Institute of Postgraduate Medical Education and Research, India and Dr. Vijay Chauhan from University of Toronto General Hospital, Canada for their clinical inputs.
Abbreviations
APDA = action potential duration alternans
BSM = body surface map
ICD = implantable cardioverter defibrillator
SCD = sudden cardiac death
TMP = transmembrane potential
TWA = T-wave alternans


