All published articles of this journal are available on ScienceDirect.

Myocardial Perfusion SPECT Utility in Predicting Cardiovascular Events Among Indonesian Diabetic Patients
Authors Info & Affiliations
Abstract
Background:
Indonesia has the fourth largest number of diabetes patients after India, China and the USA. Coronary artery disease (CAD) is the most common cause of death in diabetic patients. Early detection and risk stratification is important for optimal management. Abnormal myocardial perfusion imaging (MPI) is an early manifestation in the ischemic cascade. Previous studies have demonstrated the use of MPI to accurately diagnose obstructive CAD and predict adverse cardiac events. This study evaluated whether MPI predicts adverse cardiac event in an Indonesian diabetic population.
Method:
The study was undertaken in a consecutive cohort of patients with suspected or known CAD fulfilling entry criteria. All had adenosine stress MPI. The end point was a major adverse cardiac event (MACE) defined as cardiac death or nonfatal myocardial infarction (MI).
Results:
Inclusion and exclusion criteria were satisfied by 300 patients with a mean follow-up of 26.7 ± 8.8 months. The incidence of MACEs was 18.3% among diabetic patients, versus 9% in the non-diabetic population (p < 0.001). A multivariable Cox proportional hazard model demonstratedin dependent predictors for a MACE as abnormal MPI [HR: 9.30 (3.01 – 28.72), p < 0.001], post stress left ventricular ejection fraction (LVEF) ≤30% [HR:2.72 (1.21 – 6.15), p = 0.016] and the patients diabetic status [HR:2.28 (1.04 – 5.01), p = 0.04]. The Kaplan Meier event free survival curve constructed for the different subgroups based on the patients’ diabetic status and MPI findings demonstrated that diabetic patients with an abnormal MPI had the worst event free survival (log rank p value < 0.001).
Conclusions:
In an Indonesian population with suspected or known CAD abnormal adenosine stress MPI is an independent and potent predictor for adverse cardiovascular events and provides incremental prognostic value in cardiovascular risk stratification of patients with diabetes.
INTRODUCTION
Diabetes mellitus has emerged as a significant health problem with international importance. In the year 2000 there were an estimated 171 million diabetics across the globe and this is expected to reach 366 million by 2030 [1]. In Indonesia, the prevalence of diabetes is increasing over time in a similar fashion to that of populations in the United Kingdom (UK) and United States of America (USA). Indonesia is populated by more than 200 million people with a diabetes prevalence of 5%, expected to increase to 6.5% by 2030 [1]. In a recent study, the prevalence of known diabetes in Indonesia was determined to be 1.5%, undiagnosed diabetes 4.2% (5.7% total) and impaired glucose tolerance of 10.2% [1]. Indonesia has the fourth highest number of diabetic patients in the world behind India, China and the USA [1].
Cardiovascular diseases account for between 70% and 80% of the mortality in diabetic patients [2-3]. Indeed, diabetic patients confront more rapid development of coronary artery disease (CAD) with a higher incidence of heart failure (HF), myocardial infarction (MI) and cardiac death [4]. In a series of 4755 clinical patients presenting with suspected CAD undergoing MPI investigation, even in a relatively short follow up period of 2.5 years, the diabetic cohort sustained nearly twice (8.6% versus 4.5%) the cardiac event rate (cardiac death or nonfatal MI) compared to the non-diabetic patients (p <0.0001) [4]. A Finnish population-based studypublished by Haffner et al. [5] further reported the seven-year incidence rates of MI in diabetic patients who had no prior MI was similar to that of non-diabetic patient cohort with a previous MI (20% and 19% respectively), while among the diabetic population with a prior MI the incidence of subsequent MI was 45%; double that of patients with no diabetes who had prior MI. Of note, despite the reduction in CAD related mortality in the general population over the last 3 decades, CAD mortality in diabetic patients has not followed the same decreasing trend enjoyed by non-diabetic patients [5]. This observation may in part be related to the high prevalence of cardiac autonomic neuropathy (CAN) among diabetics [6-8], resulting in the reported high incidence of silent ischemia and silent MI [9,10] with consequent surge in cardiac death and HF [11,12].
Myocardial perfusion imaging (MPI) with single photon emission computed tomography (SPECT) has been extensively employed as a diagnostic tool in CAD, and is a potent prognostic tool for risk stratification [4]. Indeed, its role in diabetic patients with asymptomatic CAD has been widely reported [13]. MPI plays an important role in identifying those diabetic patients most at risk of CAD and, thus, in need of more aggressive management [11]. This is important because once CAD is symptomatic, diabetic patients confront significant morbidity and risk of mortality [14]. A number of investigators have examined the role of MPI in detection of silent ischemia among diabetic patients with no known or suspected CAD. In an asymptomatic population, Mohagheghie et al. [13] reported 30.1% of patients to have an abnormal MPI; most (92%) with reversible defects. De Lorenzo et al. [14] reported 26% of diabetic patients with no known history of CAD to have abnormal MPI. In their study, a positive or abnormal MPI was associated with a 9% annual risk of MI or cardiac death while normal MPI was associated with a relatively low annual cardiac event risk of 2%. In the non-diabetic diagnostic cohort, the risk of future cardiac events (MI or cardiac death) up to 5 years following a normal exercise stress MPI has been shown to range from 0.2%/year [14] to 0.7%/year [12]. Prior et al. [9] reported a 31% prevalence of silent ischemia in diabetic patients and the Detection of Ischemia in Asymptomatic Diabetics (DIAD) study [10] found 22% prevalence of silent ischemia in asymptomatic diabetics.
It is expected that the prevalence of a positive MPI will vary with patient age and gender, but also with the stage of disease for diabetes and cardiovascular co-morbidity. This study was conducted to examine the incremental prognostic value of SPECT MPI in risk stratification of an Indonesian diabetic patient population with known or suspected CAD.
METHODS
Study Population
The study population was a consecutive cohort of patients with suspected CAD or known CAD referred for diagnostic investigation with adenosine MPI stress SPECT at the National Cardiac Centre in Jakarta. Patients were excluded if they were lost to follow-up at 3years post index-SPECT MPI study, if patients died or subsequently underwent a coronary revascularization procedure [percutaneous coronary intervention (PCI) or coronary bypass surgery (CABG)] within 60 days post index-SPECT MPI, if patients had a documented history of prior MI or coronary revascularization, severe valvular disease and/or non-ischemic cardiomyopathy. The study was approved by the Centre’s Institutional Review Board.
Adenosine Myocardial Perfusion Study Protocol
Adenosine was infused at a rate of 140 μg/kg body weight per minute for 6 minutes following 24 hours of caffeine cessation. At the end of the third minute of adenosine infusion, 99mTc-Tetrofosmin was injected intravenously. A total of 7-10mCi (259-370 MBq) was administered at stress, and 15-25 mCi (555-925 MBq) was administered at rest. Blood pressure and heart rate were measured and recorded at rest, during adenosine infusion, and during recovery. Twelve-lead electrocardiography (ECG) was recorded at each minute and continuously monitored for leads aVF, V1, and V5 (15).
The SPECT acquisition commenced approximately 60 minutes post radiopharmaceutical administration. Studies were performed following a one-day stress-rest protocol. All the cardiac SPECT imaging was performed using a Siemens eCam signature dual head gamma camera equipped with a low-energy, high-resolution collimator peaked at 140 keV with a 20% energy window. SPECT data was acquired in a supine position using cardiac configuration (76 degrees), circular orbit of 104 degree (180 degree data), 1.45 zoom and a 64x64 matrix. The 180 degrees of data was acquired in 32 projections for 20 seconds per projection with ECG gating of 8 intervals. Reconstruction employed 4-DM software and attenuation correction.
SPECT Image Interpretation
The 17-segment model standardized by the American Society of Nuclear Cardiology (ASNC) was used for visual interpretation of each study. Uptake in each myocardial segment was recorded at stress and at rest, on a scale with scores from 0 (normal) to 4 (absent uptake). ECG-gated SPECT and the calculated LVEF values were available for the readers to incorporate into their segmental scoring decisions [16]. The MPI LVEF subsequently reported was taken from the post-stress perfusion images [17]. The summed stress score (SSS) (sum of the 17 individual segment scores from stress MPI [ranging from 0 to 68]) was used for the primary analyses. A study with SSS score of < 4 was defined as normal, SSS 4-8 mildly abnormal and a SSS > 8 moderate – severely abnormal.
Clinical Characteristics at Baseline and Follow-up
Clinical characteristics were obtained at baseline and at follow-up visits. Traditional risk factors such as diabetes, hypertension, dyslipidaemia, smoking and family history of premature CAD were also established. Diabetes mellitus was defined according to American Diabetes Association criteria and was considered present if the patient used oral diabetic medications or insulin. The body weight and height were also measured to determine body mass index (BMI).
Study Endpoint
The primary endpoint of the study during follow-up was a major adverse cardiac event (MACE) which was defined as cardiac death or myocardial infarction. Coronary revascularization was defined as a secondary end point. The medical records of all the patients enrolled were reviewed and, where necessary, subjects or alternates were interviewed via telephone with regard to hospitalization and medical procedures after the MPI study. Particular attention was paid to gleaning information relating to hospitalization due to a cardiovascular problem and cardiac revascularization procedures. Out of hospital cardiac death was confirmed through autopsy results or death certificate.
Statistical Analysis
All continuous variables are expressed as the mean value ± SD. The mean differences for continuous variables were compared by the Student t test (2-tailed). Categorical variables were compared as means using a χ2 (chi square) statistic. A P value < .05 was considered statistically significant. The Cox proportional hazards regression model was used to identify variables that provided the best predictors of MACE. Cumulative survival curves as a function of time (months) after the index MPI score were generated with the Kaplan-Meier method.
RESULTS
Patient Characteristics and Outcome Events
Of the consecutive 1036 patients enrolled into the study who underwent a MPI-SPECT, a total of 300 patients fulfilled the inclusion and exclusion criteria to form the study cohort. Table 1 summarizes the clinical characteristics of the study sample. There were 87 (29%) patients with and 213 (71%) patients without diabetes. The mean age was 56.3± 10.5 years, 60% were male, and co-morbidity included dyslipidaemia (75.0%), hypertension (61.3%), obesity (30.3%), family history of CAD (22.3%) and smoking (20.0%). Abnormal MPI was found in 31% of participants. A total of 42.3% of the patients had typical angina, and 9.3% had a LVEF≤ 30%.
Baseline Characteristic of the Study Population
| Variable | Description (%) |
|---|---|
| Age (years) | 56.3 ± 10.5 |
| Sex | |
| Male | 180 (60.0) |
| Risk factors | |
| Hypertension | 184 (61.3) |
| Diabetes | 87 (29.0) |
| Dyslipidemia | 225 (75.0) |
| Obesity | 91 (30.3) |
| Family History | 67 (22.3) |
| Smoker | 60 (20.0) |
| Abnormal MPI | 93 (31.0) |
| Typical angina | 127 (42.3) |
| LVEF (%) (median ; min-max) | 71 (12 - 96) |
| LVEF ≥ 30% | 28 (9.3) |
| MACE | 27 (9.0) |
MACE = Major Adverse Cardiovascular Event
Abnormal MPI = SSS ≥ 4
LV EF = Left ventricle ejection fraction
Patient’s Characteristics According Diabetic Status
| Variable | DM (-) (N=213) | DM (+) (N=87) | P Value |
|---|---|---|---|
| Age (years) | 55.3 ± 10.8 | 58.8 ± 9.2 | 0.005 |
| Sex | |||
| Male | 123 (57.7) | 57 (65.5) | 0.213 |
| Risk factors | |||
| Hypertension | 117 (54.9) | 67 (77.0) | <0.001 |
| Dyslipidemia | 158 (74.2) | 67 (77.0) | 0.607 |
| Obesity | 69 (32.4) | 22 (25.3) | 0.224 |
| Family History | 45 (21.1) | 22 (25.3) | 0.432 |
| Smoker | 43 (20.2) | 17 (19.5) | 0.899 |
| Abnormal MPI | 54 (25.4) | 39 (44.8) | 0.001 |
| Typical angina | 84 (39.4) | 43 (49.4) | 0.112 |
| LV EF ≤ 30% | 13 (6.1) | 15 (17.2) | 0.003 |
Abnormal MPI = SSS ≥ 4
Univariate Analysis for Factors Associated with MACE
| Variable | MACE (-) (N=273) | MACE (+) (N=27) | P value | HR (95% CI) |
|---|---|---|---|---|
| Age (years) | 56 ± 10.5 | 59 ± 10.3 | 0.112 | 1.03 (0.99 - 1.07) |
| Sex | ||||
| Male | 159 (58.2) | 21 (77.8) | 0.054 | 2.45 (0.99 - 6.08) |
| Risk factors | ||||
| Diabetes | 71 (26.0) | 16 (59.3) | 0.001 | 3.91 (1.81 - 8.44) |
| Hypertension | 166 (60.8) | 18 (66.7) | 0.528 | 1.29 (0.58 - 2.88) |
| Dyslipidemia | 208 (76.2) | 17 (63.0) | 0.123 | 0.54 (0.25 - 1.18) |
| Obesity | 84 (30.8) | 7 (25.9) | 0.571 | 0.78 (0.33 - 1.84) |
| Family History | 61 (22.3) | 6 (22.2) | 0.860 | 0.92 (0.37 - 2.29) |
| Smoker | 53 (19.4) | 7 (25.9) | 0.409 | 1.44 (0.61 - 3.41) |
| Abnormal MPI | 70 (25.6) | 23 (85.2) | <0.001 | 15.17 (5.23 - 43.94) |
| Typical angina | 116 (42.5) | 11 (40.7) | 0.853 | 0.93 (0.43 - 2.0) |
| LVEF ≤30% | 17 (6.3) | 11 (40.7) | <0.001 | 8.55 (3.96 - 18.47) |
| * P value significant at alfa value 0.05 | ||||
MACE = Major Adverse Cardiovascular Event (primary end point) Abnormal MPI = SSS ≥ 4
LV EF = Left Ventricle Ejection Fraction
Summary of Multivariate Analysis
| Variable | P Value | HR (95% CI) |
|---|---|---|
| Abnormal MPI | <0.001 | 9.30 (3.01 - 28.72) |
| LVEF ≤30% | 0.016 | 2.72 (1.21 - 6.15) |
| Diabetes mellitus | 0.04 | 2.28 (1.04 - 5.01) |
* Variables that included in model multivariate analysis are age, gender, DM, dyslipidemia, abnormal MPI (SSS≥4), and LVEF≤30%
Patient’s Groups According to Diabetic Status and MPI
| Variable | MPI (-) DM (-) (N=159) |
MPI (-) DM (+) (N=48) |
MPI (+) DM (-) (N=54) |
MPI (+) DM (+) (N=39) |
P Value |
|---|---|---|---|---|---|
| Age (years) | 54.6 ± 11 | 59.5 ± 9.4 | 57.1 ± 10.2 | 57.9 ± 8.9 | 0.021* |
| Sex | |||||
| Male | 85 (53.5) | 27 (56.3) | 38 (70.4) | 30 (76.9) | 0.017^ |
| Risk factors | |||||
| Hypertension | 80 (50.3) | 42 (87.5) | 37 (68.5) | 25 (64.1) | <0.001^ |
| Dyslipidemia | 121 (76.1) | 40 (83.3) | 37 (68.5) | 27 (69.2) | 0.286 |
| Obesity | 49 (30.8) | 14 (29.2) | 20 (37.0) | 8 (20.5) | 0.395 |
| Family History | 34 (21.4) | 10 (20.8) | 11 (20.4) | 12 (30.8) | 0.601 |
| Smoker | 30 (18.9) | 5 (10.4) | 13 (24.1) | 12 (30.8) | 0.099 |
| Typical angina | 60 (37.7) | 22 (45.8) | 24 (44.4) | 21 (53.8) | 0.280 |
| LV EF (%) | 74 (22 - 96) | 77 (17 - 94) | 56 (19 - 87) | 36 (12 - 85) | <0.001^ |
| LV EF ≤30% | 2 (1.3) | 1 (2.1) | 11 (20.4) | 14 (35.9) | <0.001^ |
| MACE | 1 (0.6) | 3 (6.3) | 10 (18.5) | 13 (33.3) | <0.001^ |
MPS (-) = normal (SSS<4) MPS (+) = abnormal (SSS>4) MACE = Major Cardiovascular Events (primary end point) *P value ANOVA ^ P value Chi-square
Comparison of clinical characteristics between those with diabetes and those without diabetes (Table 2) demonstrated that patients with diabetes were significantly older, and more frequently had hypertension (77.0% versus 54.9%, p <0.05). Moreover, patients with diabetes also more frequently had an abnormal MPI-SPECT (44.8% versus 25.4%, p <0.05) and had a higher prevalence of LVEF≤ 30% (17.2% versus 6.1%, p< .05). follow-up of 26.7 + 8.8 months, 27 of 300 (9.0%) patients were identified to have MACE (Table 3). Of the 27, 23 (85.2%) patients sustained cardiac death and 4 (14.8%) had non fatal MI. Eighteen of the 300 (6%) patients had cardiac revascularization (PCI or CABG) as a secondary end point. For the 213 non-diabetic patients, there were 10 (4.7%) cardiac deaths, 1 (0.5%) nonfatal-MI. Nine (4.2%) patients had cardiac revascularization. For the 87 diabetic patients, there were 13 (14.9%) cardiac deaths, 3 (3.4%) had a MI, and 9 (10.3%) patients had cardiac revascularization.
Predictors for MACE
Comparison of clinical and diagnostic characteristics of those who experienced a MACE and those who did not experience a MACE was performed. The univariate analysis showed that diabetes, abnormal MPI-SPECT, and LVEF≤ 30% were statistically significant predictors for MACE (Table 4). Fig. (1) illustrates the univariate analysis for MACE according to diabetes status, abnormal MPI and LVEF≤ 30%. Using age, gender, diabetes, dyslipidaemia, abnormal MPI (SSS≥4), and LVEF ≤30% as variables in multivariate analysis, the multivariate analysis demonstrated that
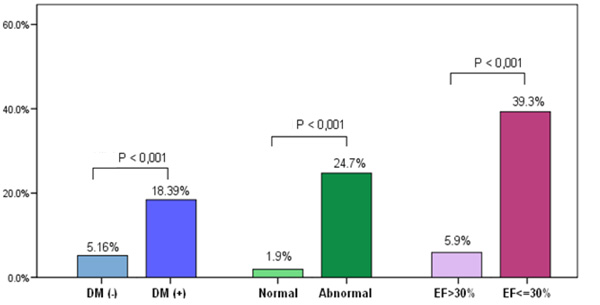
MACE (primary end point) on the Y axis according to Diabetes Mellitus (DM) status, MPI normality and LVEF.
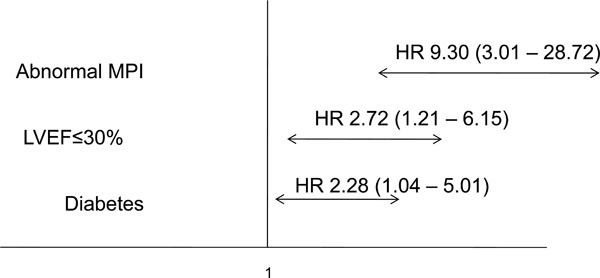
Independent predictors for MACE (primary end point).
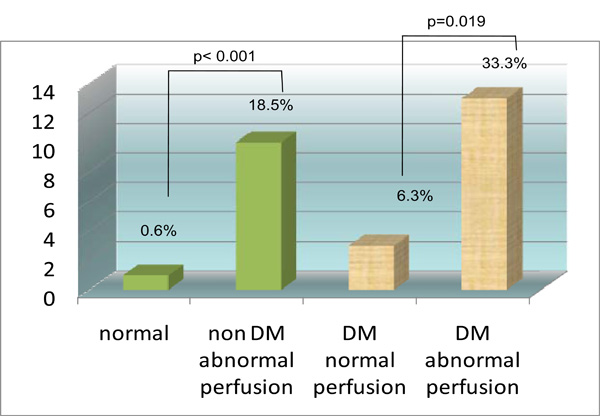
Incremental prognostic value of MPI startified according to diabetic status. Y axis is percent event rate (cardiac death or MI).

Kaplan-Meier event-free survival (primary end point) curves as a function of diabetes and myocardial perfusion.

Kaplan-Meier event-free (primary end point) survival curves as a function of SSS value in diabetic patients.
diabetes, abnormal MPI-SPECT and an LVEF≤ 30% were statistically significant independent predictors for MACE in our patient population (Table 4 and Figs. 2 and 3).
Incremental Prognostic Value of MPI
For patients with diabetes, 39 (44.8%) patients had an abnormal MPI-SPECT while 48 (55.2%) patients had a normal MPI-SPECT (Table 5). There were 33.3% (n=13) diabetic patients with an abnormal MPI who experienced a MACE while only 6.3% (n=3) diabetic patients with a normal MPI experienced a MACE (chi square p value 0.019). For patients without diabetes, 54 (25.3%) patients had an abnormal MPI-SPECT while 159 (74.7%) patients had a normal MPI-SPECT (Table 5). There were 18.5% (n=10) non diabetic patients with an abnormal MPI who experienced a MACE while only 0.6% (n=1) non diabetic patients with a normal MPI experienced a MACE (chi square p value <0.001). The Kaplan Meier survival curve (Fig. 4) comparing patients without diabetes with normal a MPI, patients without diabetes with an abnormal MPI, patients with diabetes and with a normal MPI, and patients with diabetes and with an abnormal MPI showed significant differences between these 4 groups (log rank p<0.001). The Kaplan Meier survival curve (Fig. 5) comparing diabetic patients with a summed MPI score (SSS) <4, a SSS 4 to 8 and a SSS >8 also showed significant differences between these 3 groups (log rank p=0.001).
In diabetic patients, the absolute risk of a positive MPI having a MACE is 33.3% while for a negative MPI it is 6.3%. Thus, the relative risk of a MACE is 5.3 for a positive MPI in diabetic patients. Conversely, the absolute risk for a MACE of a positive MPI in non-diabetic patients is only 18.5% while for a negative MPI it is 0.6%; a relative risk of 3.1.
DISCUSSION
Previous studies have established the prognostic value of a stress MPI-SPECT in patients with known or suspected CAD, particularly in predicting cardiac death and MI [18]. In an Indonesian patient population, this study found diabetes, abnormal MPI (defined as SSS ≥ 4) and LVEF ≤ 30% to be independent predictors for MACE.
The clinical characteristics of this Indonesian diabetic patient population differ from previous studies conducted in western countries. Firstly, diabetic patients in this study tended to be younger. The mean age of this diabetic population was 58.8 ± 9.2 years which is substantially younger than other published studies [4,12,15,16,19,20]. This is concordant with the findings of Wild et al. [2], who concluded similarly that diabetic patients in developing countries tended to be younger than diabetic patients in developed countries. This is consistent with the delayed dilution of lifestyle based risk factors in developing economies. Secondly, this diabetic population had a higher incidence of dyslipidemia (77%) compared to previous studies (33% to 48%) [4,12,15,16,19,20].
Our study identified diabetes as an independent predictor for MACE, a finding supported by other studies [19,21]. In diabetic patients, impairment of endothelium-dependent vasodilatation can occur in the small resistance vessels [diameter < 450 µm] of the coronary artery vascular bed [22]. This can manifest as an abnormal MPI-SPECT even among patients with angiographic normal epicardial coronary arteries [22]. The endothelial dysfunction was shown by Su et al. [23] to be present even in patients with impaired fasting glucose (IFG) and impaired glucose tolerance (IGT). Moreover, Alexanderson et al. [24] found evidence of endothelial dysfunction in asymptomatic and recent onset (< 1 month) diabetes. Not only is the presence of diabetes a predictor of adverse cardiac events, the duration of diabetes was also found by Schinkel et al. [15] to be a clinical predictor for adverse cardiac events.
Our study described an abnormal MPI-SPECT as an independent predictor of MACE. When diabetic patients were further stratified on the basis of their SSS value (Fig. 5), our study showed significant differences in the event-free survival of diabetic patients with a SSS < 4 (normal), SSS 4-8 (mildly abnormal) and a SSS > 8 (moderate – severely abnormal). Over the mean follow-up period of 26.7 ± 8.8 months, MACE occurred in 3 (6.3%) diabetic patients with a normal MPI, in 4 (25.0%) diabetic patients with a mildly abnormal and in 9 (39.1%) diabetic patients with a moderate – severely abnormal MPI (p log rank value = 0.001). Among the non-diabetic Indonesian population in our study, a normal MPI had a low event rate of 0.6% during follow-up (0.27% annually). This result is concordant with the 0.2% [14] to 0.6% [12] previously published annual event rate for patient cohort with normal exercise stress MPIs. The relatively high cardiac event rates (6.3%, or 2.83% annually) among our diabetic patients with normal MPIs is relatively higher than previously reported in diabetic cohorts who underwent stress myocardial perfusion studies, with hard event rates of less than 2% [19,25] is likely to be, at least in part, the consequence of the deleterious effects of diabetes as a cardiovascular risk factor among the studied Indonesian patient cohort and possibly our population were in general further along the progressive cascade of disease. Indeed, the use of pharmacologic stress per se may denote a higher risk group [26]. MPI among Indonesians with diabetes and suspected or known CAD could provide a useful non-invasive tool for risk stratification to identify those at high risk for MACE.
Study Limitations
The retrospective nature of the data collection did not allow adjustments of risk estimates based on the diseases that developed subsequent to recruitment. There was also no detailed information about the duration of diabetes or the degree of diabetic control.
CONCLUSION
This study demonstrated that adenosine stress MPI-SPECT in an Indonesian population with suspect or known CAD has prognostic value for MACE in diabetic patients. The elevated relative risk for a MACE in diabetic patients with a positive MPI compared to non-diabetic patients supports a role for MPI stratification of diabetic patients with suspected or known CAD.
CONFLICT OF INTEREST
The author(s) confirm that this article content has no conflict of interest.
ACKNOWLEDGMENTS
The authors thank Antono Sutandar MD for critically reading the manuscript.