All published articles of this journal are available on ScienceDirect.

Water Soluble Vitamin E Administration in Wistar Rats with Non-alcoholic Fatty Liver Disease
Authors Info & Affiliations
Abstract
Objective:
A diet rich in fat is associated with hepatic fat deposition [steatosis; non-alcoholic fatty liver disease (NAFLD)]. The exact cause of NAFLD however, is still unknown. The aim of this study was to assess the effect of a water-soluble formulation of vitamin E on a dietary-induced-NAFLD animal model.
Methods:
Adult male Wistar rats (n=20) were allocated to 2 groups: Controls (Group A, n=6), which received a standard chow diet for 24 weeks and a High Cholesterol group (HC: n=14), which received a standard chow diet enriched with cholesterol for the first 14 weeks of the experiment (t1). At t1, the HC group was divided into: Group HC(B), which received a high-saturated-fat/high-cholesterol (HSF/HCH) diet and Group HC(C), which followed the same HSF/HCH diet but was also administered water soluble vitamin E (10 IU/kg body weight/day), for 10 more weeks.
Results:
At the end of the study, group HC(C) exhibited significantly lower mean total cholesterol (T-CHOL) than group HC(B) (p<0.001). No significant differences were observed between HC(C) and Control groups in blood glucose and serum lipid concentrations. Liver Function Tests did not vary between all groups at the end of the study. Animals in group HC(B) exhibited higher SGOT at the end of the study compared with the beginning of the study (p<0.05). Group HC(B) exhibited the highest scores in steatosis, and grading (according to the NAFLD scoring system) in the histopathological analysis (p≤0.001 in all cases).
Conclusions:
Vitamin E seems to exert a hypolipidemic and hepatoprotective role in the presence of a HSF/HCH atherogenic diet in a rat model.
INTRODUCTION
Non-alcoholic fatty liver disease (NAFLD) is defined as the spectrum of benign fatty liver (steatosis) to necro-inflammation and fibrosis or non-alcoholic steatohepatitis (NASH) in the absence of excessive alcohol ingestion [1-4]. The prevalence of NAFLD is estimated between 20-30% in Western populations [5]. In the US it affects 30% of adult population and 1 out of 10 children aged 1-19 years [6]. Even though the exact pathogenesis of NAFLD remains uncertain [4, 7], diets high in fat (e.g. Western diet) have been consistently implicated [8-10].
The link between NAFLD and Western type high fat (HF) diets seems to be the Metabolic Syndrome (MetS) [4]. More specifically, NAFLD could be characterized as the hepatic manifestation of MetS, since MetS includes metabolic abnormalities such as hepatic insulin resistance, visceral obesity, hypertension and hyperglycaemia [11]. Insulin resistance plays a major role in NAFLD development and is followed by increased production of reactive oxygen species (ROS), which in turn promotes tissue inflammation [12].
A large number of studies have implicated NAFLD as an important cause of future liver-related morbidity [13]. In clinical practice, weight loss is the primary conservative therapeutic solution, while bariatric surgery is proving to be an effective option for patients with a body mass index (BMI) greater than 35 kg/m2 [14]. Among many drugs, vitamin E and insulin-sensitizing agents have been proposed as promising agents for treating NAFLD [15, 16].
Vitamin E is fat soluble and a potent antioxidant that reduces ROS formed during fat oxidation; ROS can cause a chronic inflammatory response [17]. Eight fat-soluble compounds are grouped under the term “Vitamin E”, including tocopherols and tocotrienols; α-tocopherol is an important lipid-soluble antioxidant and the most biologically active form of vitamin E. It functions through the glutathione peroxidase pathway protecting cell membranes from oxidation by reacting with lipid radicals produced in the lipid peroxidation chain reaction. α-tocopherol contributes significantly to the removal of free radical intermediates and the interruption of the oxidation reaction [18, 19].
The aim of the present study was to investigate the potential role of vitamin E in preventing fat infiltration in the liver of experimental models fed a HF diet.
MATERIALS AND METHODS
Selection and Description of Animals
A total of 20 male Wistar rats, aged 13-15 weeks, were used. The rats were housed in groups of 3 in the Animal Housing Facility of the Laboratory of Experimental Surgery and Surgical Research “N.S. Christeas”, Athens University Medical School, in a controlled environment. All conditions followed National and European legislation and standards, including cages (Tecniplast S.p.a., Italy) and the environment with 55% relative humidity, central ventilation (15 air changes/h), temperature of 20°C ± 2°C and artificial 12-h light-dark cycle. Access to food and water was ad libitum. The experimental protocol was approved by the Veterinary Service of the Municipality of Athens and the Athens University Medical School Bioethics Committee.
Following acclimatization, the rodents were randomized and assigned to 2 experimental groups. The randomization was based on blood glucose and serum lipid concentrations. Control group (Group A, n=6) received a standard chow diet for 24 weeks; and High Cholesterol Diet group (Group HC) (n=14) received a standard chow diet enriched with 2% cholesterol for the first 14 weeks. At 14 weeks (t1) group HC was randomly divided into 2 experimental groups: High Saturated Fat and High Cholesterol group (Group HC(B), n=7), which received 2% cholesterol + 40% lard (HSF/HCH diet) for the remaining 10 weeks of the experiment; and High Saturated Fat and Cholesterol + Vitamin E group (Group HC(C), n=7), which followed the same dietary pattern as group HC(B), fortified with water-soluble vitamin E 10 IU/kg (100 IU d-α tocopherol/5 mL) per day during last 10 weeks Table 1. The water soluble vitamin E was kindly provided by Yasoo Health Inc., TN, USA. The dosage calculation for vitamin E was based on the average daily water consumption for each animal, since the vitamin was dissolved in the drinking water of the animals. Mean animal daily water consumption was estimated during a pilot study (n=9), where water consumption was measured daily for 14 days.
Chemical Analysis of Vitamin E Dietary Supplement
| Water soluble vitamin E analysis in 5 ml : | |
|---|---|
| d-αtocopherol | 100 I.U.th |
| d- γtocopherol | 60 mgth |
| d- β- thand δ –thtocopherols | 15 mgth |
| Total tocopherols | 142 mgth |
| Total tocotrienols | 8 mgth |
| Total tocopherols and tocotrienols | 150 mgth |
Aqua-E® registered trademark of Yasoo Health, Inc.
Baseline Characteristics Following Initial Randomization Into 2 Experimental Groups
| Parameter | Group A (n = 6) | Group HC (n = 14) | P |
|---|---|---|---|
| Glucose (mg/dl) | 152 ± 28 | 147 ± 17 | NS |
| Total Cholesterol (mg/dl) | 68 ± 9 | 62 ± 11 | NS |
| HDL Cholesterol (mg/dl) | 24 ± 3 | 30 ± 9 | NS |
| Triglycerides (mg/dl) | 91 ± 23 | 103 ± 27 | NS |
| Body Weight (g) | 341.7 ± 56.6 | 350.9 ± 29.7 | NS |
Group A: Control group; Group HC: High Cholesterol Group, NS: Non Significant
Experimental Groups’ Characteristics at 14 Weeks (t1) and at the End of the Study (tend). Group A: Control Group; Group HC(B): High Saturated Fat and High Cholesterol Group; Group HC(C): High Saturated Fat and High Cholesterol + Vitamin E group
| t | Parameter | Group A (n = 6) | Group HC(B) (n = 7) | Group HC(C) (n = 7) | Significant Differences Between Groups |
|---|---|---|---|---|---|
| t1 | Glucose (mg/dl) | 157 ± 18 | 163 ± 22 | 161 ± 18 | NS |
| Total Cholesterol (mg/dl) | 61 ± 9 | 58 ± 11 | 61 ± 8 | NS | |
| HDL Cholesterol (mg/dl) | 25 ± 3 | 30 ± 10 | 30 ± 7 | NS | |
| Triglycerides (mg/dl) | 115 ± 38 | 139 ± 31 | 109 ± 40 | NS | |
| Body Weight (g) | 425.7 ± 69.1 | 430.7 ± 31 | 407.4 ± 31.6 | NS | |
| tend | Glucose (mg/dl) | 148 ± 16 | 141 ± 23 | 144 ± 17 | NS |
| Total Cholesterol (mg/dl) | 51 ± 51 | 137 ± 112 | 67 ± 43 | HC(B) vs A*, HC(B) vs HC(C)* | |
| HDL Cholesterol(mg/dl) | 25 ± 3 | 29 ± 10 | 26 ± 13 | NS | |
| Triglycerides (mg/dl) | 86 ± 16 | 98 ± 181 | 80 ± 22 | NS | |
| Body Weight (g) | 421.3 ± 85.9 | 452.0 ± 33.01 | 435.1 ± 33.11 | NS |
Group A: Control Group; Group HC(B): High Saturated Fat and High Cholesterol group; Group HC(C): High Saturated Fat and High Cholesterol + Vitamin E group.
NS: Non Significant
* p < 0.001
1 p < 0.05 vs t1
2 p < 0.001 vs t1
Comparison of liver function markers between the 3 groups for tend (euthanasia). Group A: Control Group; Group HC(B): High Saturated Fat and High Cholesterol group; Group HC(C): High Saturated Fat and High Cholesterol + Vitamin E group.
| t | Parameter | Group A (n = 6) | Group HC(B) (n = 7) | Group HC(C) (n = 7) | Significant Differences |
|---|---|---|---|---|---|
| t0 | SGOT (IU/L) | 80 ± 16 | 69 ± 18 | 87 ± 19 | |
| SGPT (IU/L) | 14 ± 6 | 12 ± 5 | 10 ± 2 | ||
| GGT (IU/L) |
3 ± 1 | 2 ± 0.5 | 2 ± 1 | ||
| tend | SGOT (IU/L) |
86 ± 17 | 106 ± 26* | 77 ± 18 | |
| SGPT (IU/L) | 11 ± 4 | 18 ± 16 | 13 ± 5 | ||
| GGT (IU/L) |
2 ± 1 | 2 ± 1 | 3 ± 2 |
* p < 0.05 vs t0
SGOT: Serum glutamic oxaloacetic transaminase, SGPT: serum glutamic pyruvic transaminase, GGT: Gamma-glutamyltransferase
Comparison of Renal Function Markers between the 3 Groups for tend (Euthanasia). Group A: Control Group; Group HC(B): High Saturated Fat and High Cholesterol Group; Group HC© (C): High Saturated Fat and High Cholesterol + Vitamin E group.
| T | Parameter | Group A (n = 6) | Group HC(B) (n = 7) | Group HC(C) (n = 7) | Significant Differences |
|---|---|---|---|---|---|
| tend | Total Protein (mg/dl) | 7.5 ± 0.2 | 7.3 ± 0.8 | 7.3 ± 0.7 | |
| Uric Acid (mg/dl) | 0.9 ± 0.2 | 0.9 ± 0.4 | 0.8 ± 0.1 | ||
| Creatinine(mg/dl) | 1.0 ± 0.1 | 1.0 ± 0.2 | 0.9 ± 0.2 | ||
| Urea(mg/dl) | 37.7 ± 5.3 | 28.7 ± 5.5 | 21.6 ± 5.6 | Α vs HC(Β)*, Α vs HC(C)‡, B vs HC(C)* |
* p < 0.05
‡ p < 0.01
Comparison of Histopathological Outcomes between the 3 Groups. Group A: Control Group; Group HC(B): High Saturated Fat and High Cholesterol group; Group HC(C): High Saturated Fat and High Cholesterol + Vitamin E group
Ɨ p = 0.008,
‡ p = 0.0015
* p = 0.001.
Values are presented as median (interquartile range).
Linear Correlation Analysis Results between Blood Serum Markers and Histopathological Outcomes
| Parameters | T-CHOL | HDL-C | TG |
|---|---|---|---|
| Steatosis | 0.58 (p = 0.001) | 0.37 (p = 0.04) | 0.34 (p = 0.06) |
| Grade | 0.71 (p < 0.001) | 0.48 (p < 0.01) | 0.39 (p < 0.05) |
| Overall | 0.66 (p < 0.001) | 0.44 (p < 0.05) | 0.38 (p < 0.06) |
Results are shown as correlation coefficients (significance levels)
Biochemical Measurements
Blood samples were collected at baseline, at 14 weeks and at the end of the study (24 weeks; tend) prior to euthanasia following a 12-h fast of the animals. Animals were anesthetized with ether and a quantity of approximately 500 μl of blood was collected from the ocular canthus of each mouse. Blood was collected in Vacutainer tubes (BD Diagnostics, NJ, USA). Serum was separated by centrifugation at 3000 rpm for 10 min and was stored at -20°C until analysis.
Total serum cholesterol (T-CHOL), high-density lipoprotein cholesterol (HDL-C) and serum triglycerides (TG), serum gamma-glutamyl transferase (GGT), serum glutamic pyruvate transaminase (SGPT), serum glutamic oxaloacetic transaminase (SGOT), urea, total protein, uric acid and creatinine serum concentrations were determined enzymatically with commercially available kits (Biosis Biotechnological Applications, Athens, Greece). Due to the non-confirmed validity of the Friedewald formula for the calculation of low-density lipoprotein (LDL) in rodents [20] this parameter was not included in our study.
Histopathological Staining
Following euthanasia, the livers were extracted, dissected and immediately preserved for further histopathological analysis. Part of the livers was fixed in 10% formalin at room temperature. The tissues were then embedded in paraffin, sectioned and mounted on glass microscope slides. The sections were stained with hematoxylin-eosin and examined blindly by 2 independent researchers using light microscopy. More precisely, the liver was evaluated as has been previously described by the Pathology Committee of non-alcoholic steatohepatitis Clinical Research Network.The concept of semi-quantitative “grading” in NAFLD is established on the basis of a scoring system in which the components, steatosis, lobular inflammation and hepatocellular ballooning, are each semi-quantitated, then added together for an aggregate activity score (“overall grade”) [21].
Lobular inflammation is defined as the presence of an increased number of lymphocytes in the lobule. In contrast to the portal or periportal inflammation, lobular inflammation usually consists of single small clusters of mononuclear cells, rather than confluent sheets [22]. Liver fibrosis was also assessed in hepatic tissues, by the use of Masson’s trichrome stain which is useful for the evaluation of the degree of fibrosis.
Statistical Analysis
Data are expressed as mean ± 1 standard deviation (SD) for continuous symmetrically distributed variables and as median (interquartile range), otherwise. Means and SDs were also provided for skewed distributions in order to increase readability of comparisons. The normality of the distributions was assessed with Kolmogorov-Smirnov test and graphical methods. Comparisons of continuous variables were performed using Student’s t-test and Mann-Whitney’s U non-parametric test, as appropriate. Analysis of Variance (ANOVA) was used for multiple between-group comparisons of continuous variables. Kruskal – Wallis analysis was performed for multiple between-group comparisons of ordinal data. In these cases, the non-parametric Mann-Whitney’s U test was utilized for post hoc analysis. Comparisons of measurements between different time points were performed using Repeated Measures ANOVA. In all cases of multiple hypothesis testing, Benjamini-Hochberg’s False Discovery rate was applied, in order to detect significant differences, as well as to maintain a family-wise α=0.05. All tests were two-sided. Differences were considered as significant if the null hypothesis could be rejected with >95% confidence.
RESULTS
Weight and Serum Lipids
At baseline (t0) there were no significant differences in T-CHOL, HDL-C and TG concentrations between the 2 groups (Table 2). At t1 (14 weeks), the animals belonging to group HC were randomly assigned to groups HC(B) (n=7) and HC(C) (n=7), based on blood lipids. There were no significant differences in lipids and blood glucose concentrations between the 2 groups at t1 (Table 3).
At the end of the study (tend), animals belonging to Control group exhibited a significant decrease of mean T-CHOL concentration (p<0.05) and a significant increase of HDL-C (p<0.05), compared with baseline measurements (Tables 2 and 3). On the other hand, group HC(B) animals presented a significant increase of mean weight (t0: 354.6 ± 28.9 vs tend: 452.0 ± 33.0 (g), p<0.001) and T-CHOL (t0: 60 ± 8vs. tend: 137 ± 11 (mg/dl), p<0.001), as well as a significant decrease of mean TG concentration (t0: 123 ± 17 vs tend: 98 ± 18 (mg/dl), p<0.05). For the HC(C) group of animals, only a significant weight increase at the end of the study compared with baseline measurements (t0: 347.1 ± 32.3 vs tend: 435.1 ± 33.1(g), p<0.001) was observed. Furthermore, group HC(B) tend T-CHOL measurements were significantly elevated compared with t1 (p<0.001), whereas group HC(C) animals did not present any significant change between the 2 measurements (Table 3).
At tend animals belonging to group HC(B) exhibited significantly higher mean T-CHOL concentration than group HC(C) (p<0.001) and A (p<0.001) (Table 3). No significant differences were observed between HC(C) and Control groups in blood glucose and serum lipid concentrations (p >0.05). Mean animal weights did not differ significantly between groups during the study.
Liver Function Tests (Table 4)
At t0, animals belonging to the 3 groups exhibited comparable SGOT, SGPT and GGT serum concentrations (p>0.05).
Also, at the end of the experiment (tend), animals belonging to the 3 groups did not differ in SGOT, SGPT and GGT serum activities (p>0.05). Only SGOT serum levels, in animals belonging to group HC(B), were significantly increased at tend, compared to t0 (p< 0.05).
Renal Function Tests (Table 5)
At tend, no statistically significant differences were observed in total protein, uric acid and creatinine serum concentrations, between the 3 groups (p>0.05). Mean urea serum concentrations differed significantly between the 3 groups at euthanasia (p<0.05).
Histopathological Study
All liver samples from Control group were assessed normal by the histopathological study and all relevant scores were equal to 0. On the other hand, group HC(B) exhibited the highest scores in steatosis, grading and overall results compared with Control and HC(B) group (p=0.001 in all cases) (Fig. 1). Even though group HC(C) exhibited significantly lower values than HC(B) in all measured parameters, it exhibited higher scores in degree of steatosis (p=0.008), grading (p=0.0015) and overall score (p=0.0015) than Controls (Table 6). Histopathological findings strongly correlated with T-CHOL concentration at euthanasia and weakly with HDL-C and TG concentrations (Table 7). No statistically significant correlations were detected between histopathological findings and measured liver enzymes. The histopathological study demonstrated almost insignificant amounts of fibrous connective tissues in the liver parenchyma.
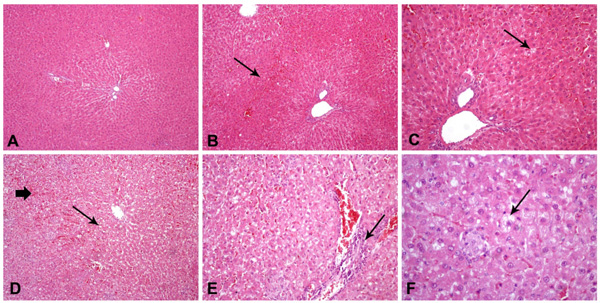
Hematoxylin and eosin staining of hepatic tissue (200 and 400x).Control rats (Group A) with normal hepatocytes and liver architecture (A); Group HC(C) (HSF/HCH diet and vitamin E supplementation) rats with mild hepatic sinusoid congestion (B) and mild steatosis (C); Group HC(B) (HSF/HCH diet) rats with severe steatosis and hepatic sinusoid congestion (D), periportal (necro)-inflammatory infiltrates (E) and ballooning effect (F).
DISCUSSION
Diets enriched with various types of fatty acids have been used to model obesity and metabolic imbalances, such as dyslipidemia and insulin intolerance in rodent species [21]. The disorders that arise from high-fat feeding resemble human MetS [22, 23] and can also increase liver fat quite rapidly [24]. This liver fat accumulation is associated with hepatic insulin resistance and may or may not occur before significant increases in peripheral fat deposition [24, 25].
In this experiment, a diet enriched in saturated fat (lard) and cholesterol produced an array of metabolic disturbances and NAFLD. Although, there were no significant differences in body weight between the groups, there was a significant weight increase recorded in both groups HC(B) and HC(C) after HSF/HCH feeding at tend compared with t1and t0. Others have also shown no influence on weight gain in rats administered HF diets, including lard [26], with differing carbon-chain length and degree of saturation of dietary fat [27]. A possible explanation is that rats on HF diets may not consume as many grams of food as those on low-fat diets [28].
There were significant alterations in blood lipids between the 3 groups. T-CHOL was significantly increased in group B at the end of the study compared with Control and HC(C) groups. The same trends for liver cholesterol concentration and serum T-CHOL levels were reported in rats on a high saturated fat diet [29].
The prevalence of hyperlipidemia in humanswith NAFLD ranges from 20 to 92% [30]. Indeed, a high cholesterol dietary intake can lead to fat infiltration of hepatic tissue. In many experimental studies a correlation between the increased cholesterol intake and the hepatic damage is reported while the consumption of a HCH diet induces hepatic steatosis [31-33]. TG and HDL-C levels however, did not differ among the 3 experimental groups.
In experimental studies including HF dietary groups, TG concentrations do not exhibit a consistent pattern. For example, higher TG levels are reported on groups following high saturated fat diets than unsaturated fat diets [29]. On the other hand, others have shown that serum TG are not significantly different between HF fed animals and those fed normal diets [34], while there have been reports of animals which received normal diet and presented higher levels of TG than animals on HF feeding [35]. The redirection of fatty acids into hepatic TG storage may be an initial protective mechanism to lower hepatic intracellular fatty acid concentrations. Intracellular fatty acid storage as TG would then serve to maintain liver insulin sensitivity [36-38].
HDL-C levels were increased in the control group at the end of the experiment compared with baseline. A similar finding was observed by others [39] and may be attributed to the changes in cholesterol metabolism in aging rats. No significant differences in HDL-C were observed at the end of the study between the 3 experimental groups. This finding is similar to other studies [40]. However, contradictory results have also been reported where HF feeding significantly decreased HDL-C levels [41].
In our study, high cholesterol feeding of rats for 14-weeks, without saturated fat supplementation, did not affect plasma cholesterol levels. Although, there are reports that a cholesterol enriched diet can lead to changes in plasma cholesterol levels in rats [42, 43], it is also accepted that rats are particularly resistant to the development of hypercholesterolemia and atherosclerosis and have a special ability to maintain their T-CHOL levels [44]. Therefore, in order to induce hypercholesterolemia or atherosclerosis in rats, cholesterol feeding is used in combination with other additives [45-47]. Dietary cholesterol however, similarly to our experiment, has been shown not to influence plasma cholesterol concentration in young Wistar rats while increasing T-CHOL levels in older Sprague-Dawley rats [47].
HSF/HCH feeding resulted in high T-CHOL levels in rats in group HC(B) as compared with baseline. In group HC(C), vitamin E co-administration led in decreased T-CHOL compared with the non-treated HSF/HCHfed group of rats. It should be noted that this reduction in T-CHOL is comparable to the Control group T-CHOL levels. For lipoprotein receptors, the maintenance of their normal structure is important for their function since they facilitate the cellular uptake of serum lipids from the blood. Increased oxidative stress produces ROS which react with lipoproteins to produce oxidation states, thus diminishing the cellular uptake of lipids from the blood [48-50]. In our study and as previously described [51, 52], vitamin E acting as an antioxidant may have contributed to elevated cellular lipid uptake, which results in the decrease of T-CHOL. Further to the reduction in oxidative damage, vitamin E decreases tissue levels of the inflammatory mediator Tumor Necrosis Factor-alpha (TNF-α), while it beneficially reduces Peroxisome Proliferator Activated Receptor -gamma (PPAR-γ) activity [53, 54].
It is worth noting that the vitamin E used in this experiment was water soluble. This form of vitamin E is "water solubilized" by the addition of compounds during the manufacturing process and ishypothesized that it is more efficiently absorbed through the intestinal wall [55]. Because the digestive tract requires fat to absorb vitamin E, people on low fat diets or with fat-malabsorption may benefit from the water soluble form of vitamin E, especially since they are more likely to become deficient than people without such disorders.
The documented potential health hazards [56] associated with high-dosage vitamin E administration, such an increase in prostate cancer incidence [57], were avoided in this study by administering a small dose of 10IU/kg. However, the bioavailability of this form of vitamin E was enhanced, with the addition of a chemical substance known as d-α-tocopherylpolyethylene glycol-1000 succinate (TPGS). Under the European Commission, TPGS incorporation makes the vitamin highly bioavailable and enhances its absorption Therefore, small therapeutic dose of vitamin E, were used with no documented adverse effects on health.
In Wistar rats, similarly to this study, no significant changes in the SGOT and SGPT levels were reported in normal and HF fed animals [54].We did not record any changes in SGOT, SGPT and GGT serum activities in all groups during the whole study except for an increase at tend compared to t0 in SGOT the High Saturated Fat and Cholesterol group.The diet has a noticeable impact on hepatic enzymes both in animals [58-60] and in healthy humans [61]. A clear relationship between marked rises in transaminases and the consumption period of a high carbohydrate diet in humans has been shown, whilst the same does not apply when receiving an isocaloric high fat-high carbohydrate diet. Therefore, carbohydrate rather than fat may be the key factor for disturbed liver function tests [62].
Other studies on liver models of steatosis in rats feeding on HF diets show that typical steatosis with or without lobular inflammation, increased liver “markers” compared with the control group [63]. Paradoxically, long-term high-saturated-fat/high-cholesterol feeding did not induce significant changes in serum hepatic enzymes in the HF fed groups compared with the control group, something that was also observed by others [64, 65].
In terms of renal function tests, serum urea levels were decreased in the HSF/HCH fed groups, compared with the control group, something that is not in accordance with the findings of others where rodents received HF and high cholesterol diets [66].The biochemical reactions leading to the production of urea take place in the liver. It is probable that the decrease in serum urea levels is associated with the extensive liver damage caused due to the increased fat infiltration of hepatic tissue [67].
Hepatic steatosis in our study was induced by a HF diet, in agreement with the literature [68]. Histological examination of the liver revealed signs of periportal inflammation in group HC(B) without distinct fibrotic changes; these histological alterations have also been described in human obesity. In accordance withour results, other adult male Wistar rat experiments show the highest rates of liver steatosis in groups receiving a HF diet [69].
The effect of duration of HF feeding is important as it may be the main determinant for the observed non-linear progression of liver fat accumulation [70]. Thus, liver fat levels may be alternatively decreasing and increasing during prolonged HF feeding [71].
Dietary composition is a significant environmental factor that may influence NAFLD severity. Various attempts have been made linking dietary habits and NAFLD in children but the majority of the studies did not use liver biopsy or other imaging techniques for verification [71, 72]. Specific micro- or macronutrients may influence cell injury, fibrosis, inflammation, or degree of steatosis but may not change liver fat deposition or surrogate markers. These features can only be assessed with biopsy-validated study designs and despite the increased scientific interest in the effect of diet on NAFLD, little information is available about diet in humans with histologically ascertained NAFLD. A study that included 43 adolescents (13 with ultrasound-confirmed-NAFLD) found no significant differences in total energy, percentage of protein, percentage of carbohydrates, percentage of fat, or cholesterol consumption compared with obese adolescents without fatty livers [77].
The most widely accepted theory implicates insulin resistance as the basic mechanism in the generation of hepatic steatosis induced by diet [73, 74]. The presumed factors initiating the procedure leading to steatohepatitis are oxidative stress and subsequent lipid peroxidation, pro-inflammatory cytokines and hormones derived from adipose tissue (adipocytokines) [75]. Antioxidants may retard the progression of NAFLD. Dietary antioxidant components including polyphenols and vitamin E promote the biochemical and histological improvement in NAFLD [41]. Various antioxidant substances are associated with the attenuation of hepatic hyperlipidemia both in vitro and in vivo [76, 77], while a flavonoid-enriched extract has been reportedto alleviate the HF diet-induced hepatic injuries in vivo [78]. The intake of some cysteine-containing (antioxidant) compounds can suppress the activity and mRNA expression of these enzymes, and contribute to decreased TG and cholesterol accumulation in liver and attenuation of hepatic steatosis in diet-induced obese mice [79, 80].
Vitamin E has been shown to improve histological disease activity in NAFLD when administered long term [81]. Animal studies improved our understanding of how vitamin E works in NAFLD. Vitamin E may prevent the development of NAFLD, largely by reducing oxidative stress, inflammation, and liver cell death by apoptosis [52]. Despite these promising results, treatment with high dose vitamin E should be carefully considered due to its association with increased risk for hemorrhagic stroke and all-cause mortality [82] in clinical trials [83].
Several studies suggest that vitamin E monotherapy is beneficial in the early stages of NAFLD, while a drug combination rather than vitamin E alone may be more effective in treating NAFLD and NASH [84]. However, in a randomized long-term clinical trial with 247 NASH patients without diabetes, where pioglitazone, high dose vitamin E or placebo (83 subjects) were given for 2 years, only vitamin E therapy, as compared with placebo, was associated with a higher rate of improvement in NASH but not with improvement in fibrosis scores [85]. The data are still conflicting regarding combination treatment of pharmacological agents and vitamin E.
FUTURE STUDIES
There is a need for extensive longitudinal human trials investigating the reversal effect of vitamin E administration on advanced fatty liver disease in humans. Furthermore, the appropriate dosage effect needs further investigation as well as the effect of the route of administration.
Children with NAFLD have been reported to have a diet that is insufficient in vitamin E which may contribute to the pathophysiology of NAFLD [86]. Thus, prevention of NAFLD with adequate amounts of vitamin E (i.e. dietary consumption or supplementation) from an early age needs further investigation especially since it is an easy and low cost intervention.
In clinical studies that assess the effect of vitamin E on NAFLD, special consideration should be given to patients that receive various pharmacological agents such as statins, insulin sensitizers etc. In statin-receiving-patients the effect of vitamin E is masked since statins have been shown to improve liver tests [87] and ultrasonographic evidence of NAFLD [88]. Kidney function protection and platelet inhibitory activity have also been attributed to vitamin E [87,88].
Future research studies may also need to account for histologic severity by differentiating simple steatosis from NASH while the effect of low consumption of vitamin E or possible associations to other vitamins D, C and antioxidants should be explored. Also, well-defined patient-populations in terms of disease risk factors, pathogenesis and prognosis are pivotal, for the identification of the best therapeutic regimen for each individual NAFLD patient.
CONCLUSIONS
The present study adds to our understanding of the effect of vitamin E on increased lipid parameters in rats and the changes of fat deposition in the liver it may cause. Our data support individualised supplementation with vitamin E, as it may prevent or reverse NAFLD and NASH, even while consuming a HF diet. Vitamin E may be effective as a monotherapyfor dietary-induced NAFLD and the metabolic disturbances that accompany it. However, further clinical studies are needed before making any definitive recommendations.
DECLARATION OF CONFLICTING INTERESTS
The authors declared no conflicts of interest with respect to the authorship and/or publication of this article.
FUNDING
The authors received no financial support for the research and/or authorship of this article.
ACKNOWLEDGEMENTS
We thank Ms Kaliopi Perrea, Panagiotis Tsakiropoulos and Nikos Tsakiropoulos for their valuable assistance in laboratory techniques.