All published articles of this journal are available on ScienceDirect.

Cardiopulmonary Exercise Testing in Patients with Chronic Heart Failure: Prognostic Comparison from Peak VO2 and VE/VCO2 Slope
Authors Info & Affiliations
Abstract
Background:
Cardiopulmonary exercise testing with ventilatory expired gas analysis (CPET) has proven to be a valuable tool for assessing patients with chronic heart failure (CHF). The maximal oxygen uptake (peak V02) is used in risk stratification of patients with CHF. The minute ventilation-carbon dioxide production relationship (VE/VCO2 slope) has recently demonstrated prognostic significance in patients with CHF.
Methods:
Between January 2006 and December 2007 we performed CPET in 184 pts (146 M, 38 F, mean age 59.8 ± 12.9 years), with stable CHF (96 coronary artery disease, 88 dilated cardiomyopathy), in NYHA functional class II (n.107) - III (n.77), with left ventricular ejection fraction (LVEF) ≤ 45%,. The ability of peak VO2 and VE/VCO2 slope to predict cardiac related mortality and cardiac related hospitalization within 12 months after evaluation was examined.
Results:
Peak VO2 and VE/VCO2 slope were demonstrated with univariate Cox regression analysis both to be significant predictor of cardiac-related mortality and hospitalization (p < 0.0001, respectively). Non survivors had a lower peak VO2 (10.49 ± 1.70 ml/kg/min vs. 14.41 ± 3.02 ml/kg/min, p < 0.0001), and steeper Ve/VCO2 slope (41.80 ± 8.07 vs. 29.84 ± 6.47, p < 0.0001) than survivors. Multivariate survival analysis revealed that VE/VCO2 slope added additional value to VO2 peak as an independent prognostic factor (χ2: 56.48, relative risk: 1.08, 95% CI: 1.03 – 1.13, p = 0.001). The results from Kaplan-Meier analysis revealed a 1-year cardiac-related mortality of 75% in patients with VE/VCO2 slope ≥ 35.6 and 25% in those with VE/VCO2 slope < 35.6 (log rank χ2: 67.03, p < 0.0001) and 66% in patients with peak VO2 ≤ 12.2 ml/kg/min and 34% in those with peak VO2 > 12.2 ml/kg/min (log rank χ2: 50.98, p < 0.0001). One-year cardiac-related hospitalization was 77% in patients with VE/VCO2 slope ≥ 32.5 and 23% in those with VE/VCO2 slope < 32.5 (log rank χ2: 133.80, p < 0.0001) and 63% in patients with peak VO2 ≤ 12.3 ml/kg/min and 37% in those with peak VO2 > 12.3 ml/kg/min (log rank χ2: 72.86, p < 0.0001). The VE/VCO2 slope was demonstrated with receiver operating characteristic curve analysis to be equivalent to peak VO2 in predicting cardiac-related mortality (0.89 vs. 0.89). Although area under the receiver operating characteristic curve for the VE/VCO2 slope was greater than peak VO2 in predicting cardiac-related hospitalization (0.88 vs 0.82), the difference was no statistically significant (p = 0.13).
Conclusion:
These results add to the present body of knowledge supporting the use of CPET in CHF patients. The VE/VCO2 slope, as an index of ventilatory response to exercise, is an excellent prognostic parameter and improves the risk stratification of CHF patients. It is easier to obtain than parameters of maximal exercise capacity and is of equivalent prognostic importance than peak VO2.
INTRODUCTION
Despite recent advances in pharmacological treatment of patients with chronic heart failure (CHF), including ACE inhibitors and β-blockers [1-4], mortality rates in patients with severe CHF remain high. The identification of patients at highest risk for early death from heart failure is of special importance. Peak oxygen consumption (peak VO2) has consistently demonstrated prognostic significance [5-8] and is the most frequently analyzed cardiopulmonary exercise test parameter [9, 10]. In conjunction with other classic risk factors such as left ventricular ejection fraction (LVEF), New York Heart Association (NYHA) class IV symptoms, and neurohormonal markers, peak VO2 is used to assess survival and the need for heart transplantation [11-14].
Peak VO2 might be underestimated because of reduced patient motivation as well as premature termination of exercise by the examiner. Recently, other ventilatory expired gas parameters obtained during exercise testing have demonstrated prognostic value. The relationship between minute ventilation and carbon dioxide production (VE/VCO2 slope) is one such cardiopulmonary exercise test parameter that appears to have clinical value [8, 14-20]. It can be derived from submaximal exercise testing and is independent of patient motivation. The purpose of this study was to compare peak VO2 and the VE/VCO2 slope for predicting cardiac related mortality and cardiac related hospitalization (12-months) in patients with CHF.
METHODS
Patients
Initially, 215 consecutive patients with chronic heart failure in stable condition were recruited. However, after the screening visit at baseline, 31 patients decided not to participate. Thus, 184 patients (mean age, 59.8 ± 12.9 years) were studied between January 2006 and December 2007. All patients were clinically stable on standard medical therapy (angiotensin-converting enzyme inhibitors, beta-blockers, nitrates, diuretics, amiodarone and digoxin as necessary) in the 3 months before the study. Criteria for eligibility were documented clinical signs and symptoms of heart failure, left ventricular ejection fraction ≤ 45%, NYHA class II to III, and sinus rhythm. Clinical characteristics of the patients are summarized in Table 1. The cause of heart failure was ischemic (52.2%) and hypertensive cardiomyopathy or idiopathic dilated cardiomyopathy (47.8%). Mitral insufficiency was present in 83 patients and was mild in all. Exclusion criteria were unstable angina, recent acute myocardial infarction, decompensated congestive heart failure, hemodynamically significant valvular heart disease, poorly controlled cardiac arrhythmias, significant chronic pulmonary illness, renal insufficiency (serum creatinine ≥ 2.5 mg/dL), exercise testing limited by angina or leg claudication, abnormal blood pressure response to exercise testing (systolic blood pressure during exercise > 250 mmHg or diastolic blood pressure > 120 mmHg, systolic blood pressure response decrease > 20 mmHg after a normal increase or decrease below the resting level), and neurological or orthopedic limitations.
Clinical Characteristics of the Study Population
| Patients (no.) | All Patients 184 | Survivors 156 | Non Survivors 28 | p |
|---|---|---|---|---|
| Age (y) | 59.8 ± 12.9 | 58.6 ± 12.9 | 67.8 ± 9.1 | 0.002 |
| Sex, male, n (%) | 146 (79.3) | 126 (80.7) | 20 (71.4) | n.s. |
| Weight (Kg) | 76.3 ± 11.7 | 77.2 ± 10.8 | 77.1 ± 11.2 | n.s. |
| Height (cm) | 169 ± 6.7 | 170 ± 7.1 | 169 ± 7.2 | n.s. |
| Body Mass Index (kg/m2) | 27.4 ± 4.1 | 26.9 ± 5.0 | 27.2 ± 4.6 | n.s. |
| NYHA – FC II/III | 2.4 ± 0.5 | 2.3 ± 0.5 | 2.8 ± 0.4 | < 0.0001 |
| LVEF (%) | 35.40 ± 7.38 | 36.45 ± 7.13 | 30.29 ± 6.62 | < 0.0001 |
| CHF cause (%) | ||||
| Ischemic | 96 (52.2) | 81 (51.9) | 15 (53.6) | n.s. |
| Non-ischemic | 88 (47.8) | 75 (48.1) | 13 (46.4) | n.s. |
| Medications (%) | ||||
| Β-blockers | 116 (63.0) | 100 (64.1) | 16 (57.1) | n.s. |
| Amiodarone | 61 (33.2) | 48 (30.7) | 13 (46.4) | n.s. |
| Nitrates | 86 (46.7) | 74 (47.4) | 12 (42.8) | n.s. |
| Diuretics | 178 (96.7) | 150 (96.1) | 28 (100) | n.s. |
| ACE- I | 153 (83.1) | 131 (83.9) | 22 (78.6) | n.s. |
| Digoxin | 65 (35.3) | 52 (33.3) | 13 (46.4) | n.s. |
| Aspirin | 96 (52.2) | 81 (51.3) | 15 (53.6) | n.s. |
| Anticoagulants | 60 (32.6) | 50 (32) | 10 (35.7) | n.s. |
CHF: Chronic Heart Failure.
Cardiopulmonary Exercise Measurements in the Overall Patients Population and in the Survivors and Non-Survivors*
| Variables | All Patients(n.184) | Survivors(n.156) | Non-Survivors(n.28) | p |
|---|---|---|---|---|
| Heart rate at rest (bpm) | 84 ± 13 | 82± 12 | 86± 14 | n.s. |
| Heart rate at peak (bmp) | 121± 21 | 119± 20 | 126± 22 | n.s. |
| Maximal work load (watt) | 98± 48 | 106± 51 | 76± 49 | 0.004 |
| VO2 peak (ml/kg/min) | 13.82 ± 3.19 | 14.41 ± 3.02 | 10.49 ± 1.7 | < 0.0001 |
| VO2-AT (ml/k/min) | 12.50 ± 3.0 | 13.04 ± 2.87 | 9.50 ± 1.71 | < 0.0001 |
| VE/VCO2 slope | 31.66 ± 7.98 | 29.84 ± 6.47 | 41.80 ± 8.07 | <0.0001 |
| VO2/HR (ml/beat) | 9.44 ± 2.65 | 9.68 ± 2.63 | 8.72 ± 2.36 | n.s. |
| Breathing reserves (%) | 41.7 ± 17.2 | 39.8 ± 16.9 | 45.2 ± 16.6 | n.s. |
* The data are given as mean ± SD.
Univariate Cox Regression Results for Peak VO2 and VE/VCO2 Slope
| Variables | Event | Number of Events | X 2 | p | 95% CI |
|---|---|---|---|---|---|
| VO2 peak | Cardiac mortality (1 y) Cardiac hospitalization (1 y) |
28 66 |
42.09 54.98 |
<0.0001 <0.0001 |
5.44 – 37.12 3.99 - 10.89 |
| VE/VCO2 slope | Cardiac mortality (1 y) Cardiac hospitalization (1 y) |
28 66 |
44.48 70.41 |
<0.0001 <0.0001 |
1.09 – 1.17 1.08 – 1.13 |
Multivariate Cox regression survival analysis
| Variables Interval | X 2 | p | Relative Risk | 95% Confidence |
|---|---|---|---|---|
| VO2 peak | 57.39 | 0.002 | 5.69 | 1.87 – 17.28 |
| VE/VCO2 slope | 56.48 | 0.001 | 1.08 | 1.03 – 1.13 |
ROC Curve Analysis for the Peak VO2 and VE/VCO2 Slope Classifications
| Variables | Event | Number of Events | Area Under the ROC Curve | p | Sensibility % | Specificity % |
|---|---|---|---|---|---|---|
| VO2 peak | Cardiac mortality (1 y) Cardiac hospitalization (1 y) |
28 66 |
0.892 0.827 |
0.0001 0.0001 |
89.3 66.7 |
79.6 86.6 |
| VE/VCO2 slope | Cardiac mortality (1 y) Cardiac hospitalization (1 y) |
28 66 |
0.891 0.888 |
0.0001 0.0001 |
89.3 78.8 |
84.7 94.1 |
CARDIOPULMONARY EXERCISE TESTING
All patients performed symptom-limited incremental cycle ergometer exercise testing with electrocardiographic monitoring. Patients pedalled in the upright position on an electronically braked cycle ergometer (Lode Corival, Groninger – The Netherlands) at a constant rate of 60 rpm. The work load started at 20 watts (W) for 3 minutes (warming-up) and increased by 1 W every 5 seconds (ramp protocol). Blood pressure was measured by auscultation every other work load. The 12-lead electrocardiogram was recorded during the final 30 seconds of every other work load and at the peak exercise. Heart rate was determined from the electrocardiographic recording. Symptoms were assessed by means of the 10-point Borg scale rating. Calibration of volumes and gases (O2 and CO2) was carefully performed before each test. The ventilatory threshold was measured by the V-slope method [21]. Peak oxygen uptake was measured with commercially available metabolic carts (Sensor Medics model Vmax, Yorba Linda, CA- USA) and defined as the highest oxygen consumption during the last 30 seconds of exercise. VE/VCO2 slope was calculated with the slope calculation option of the spreadsheet software package.
END POINT
Subjects were observed for cardiac related mortality and hospitalization 1–year after exercise testing. Medical chart review and telephone interviews were used to contact patients or their relatives. In the follow-up interviews, patients were asked about re-admission to the hospital and any other cardiac events. Events were defined as acute myocardial infarction (AMI) followed by cardiac arrest or decompensate heart failure (HF) requiring the use of an intravenous inotropic agent and loop diuretics. Cardiac-related mortality was defined as death directly resulting from failure of the cardiac system. Cardiac-related hospitalization was defined as a hospital admission directly resulting from cardiac dysfunction requiring inpatient care to correct. The most common causes of mortality, as per discharge diagnosis, were cardiac arrest, myocardial infarction, and end-stage HF. The most common causes of hospitalization were decompensated HF and coronary artery disease. Patients in whom mortality or hospitalization were of non cardiac etiology were treated as censored cases.
STATISTICAL ANALYSIS
Continuous variables are expressed as the mean ± standard deviation (SD). Discrete variables are shown as absolute value and/or percentages ± SD. Pearson’s correlation coefficient was used to evaluate the bivariate relationships. Analysis of variance with the Bonferroni correction of the post hoc test of significance was used for the statistical evaluation of the differences between groups. The chi-squared test was used for evaluation of categorized variables. Univariate Cox regression analysis was used to determine the ability of peak VO2 and VE/VCO2 slope to predict 1- year cardiac related mortality, and 1-year cardiac related hospitalization.
Multivariate Cox regression analysis (forward stepwise method) with peak VO2 and VE/VCO2 slope, was used to assess the combined effect of these variables in predicting the aforementioned end points. Entry and removal P value for the multivariate analyses were set at 0.05 and 0.10, respectively.
Receiver operator characteristic (ROC) analysis was carried out to determine the cut-off value of the parameters used in the Cox regression analysis. Survival curves were constructed by the Kaplan Meier method and were compared with the log-rank test.
Differences were considered significant at a P-value < 0.05. All analyses were performed using the MedCalc Software Version 10.4.5.
RESULTS
Baseline Characteristics
Descriptive characteristics of the study population a presented in Table 1. Ischemic cardiomyopathy was the predominant underlying cause of CHF (96 patients, 52.2%). LVEF was reduced to 35.4 ± 7.3%. All patients had symptomatic heart failure, with a mean NYHA class of 2.4 ± 0.5. The medical treatment included diuretics in 96.7%, ACE inhibitors in 83.1%, β-blockers (carvedilol, bisoprolol) in 63%, nitrates in 46.7%, digitalis in 35.3%, amiodarone in 33.2%, aspirin in 52.2% and anticoagulants in 32.6% of the patients. Twelve patients (6.5%) had pacemakers and another 19 patients (10.3%) had an implanted cardioverter-defibrillator (ICD).
FOLLOW-UP SURVIVAL
None of patients were lost to follow-up. During the median follow-up of 10 ± 3 months, 28 patients died (non-survivors). Two patients with an ICD had ventricular fibrillation, detected and successful treated by the ICD. Fourteen patients (50%) died within the first 6 months of follow-up. None of the patients underwent heart transplantation. The clinical characteristics of the survivors and non-survivors are presented in Table 1. The non-survivor were similar to the survivors in sex, body mass index, and in the cause of CHF but were older, more symptomatic (high NYHA class), and had a lower LVEF (Table 1).
CARDIOPULMONARY EXERCISE TESTING
Exercise was stopped for fatigue or exhaustion in 128 patients (69.6%), angina in 14 patients (7.6%) and dyspnea in 42 patients (22.8%). All measurements of exercise capacity with the exception of O2-pulse and breathing reserve were lower in non-survivors than survivors. There was no difference in heart rate at rest or at maximal exercise between both groups. The maximal work load was lower in non-survivors (Table 2).
CARDIOPULMONARY PREDICTORS OF MORTALITY AND HOSPITALIZATION
There were 28 cardiac-related deaths (10 suddenly and 18 from end-stage CHF) and 66 cardiac-related hospitalization within 1-year after exercise testing. There were no additional non-cardiac deaths during the follow up period. With univariate Cox regression analysis, both peak VO2 and VE/VCO2 slope were revealed to be significant predictor of all 2 outcomes assessed (Table 3). This was confirmed by the stepwise multivariate Cox proportional hazard analysis, where these two variables were considered independent predictors (Table 4). In addition, the multivariate analysis showed that only the NYHA functional class was independent predictor of mortality (p<0.0001). Cut-off values were determined by ROC curve analysis. The cut-off value for VE/VCO2 slope in predicting 1-year cardiac related mortality was 35.6 (89.3% sensibility, 84.7% specificity, AUC = 0.891 ± 0.041, p = 0.0001), and 32.5 (78.8% sensibility, 94.1% specificity, AUC = 0.888 ± 0.028, p = 0.0001) for 1-year cardiac related hospitalization. For VO2 peak cut-off value in predicting 1-year cardiac related mortality was 12.2 (89.3% sensibility, 79.6% specificity, AUC = 0.892 ± 0.025, p = 0.0001), and 12.3 (66.7% sensibility, 86.6% specificity, AUC = 0.827 ± 0.030, p = 0.0001) for 1-year cardiac related hospitalization (Table 5). The results from Kaplan-Meir analysis revealed a 1-year cardiac-related mortality of 66% in patients with peak VO2 ≤ 12.2 ml/kg/min and 34% in those with peak VO2 > 12.2 ml/kg/min (log rank χ2: 50.98, p <0.0001) (Fig. 1) and 75% in patients with VE/VCO2 slope ≥ 35.6 and 25% in those with VE/VCO2 slope < 35.6 (log rank χ2: 67.03, p < 0.0001) (Fig. 2). One-year cardiac-related hospitalization was 63% in patients with peak VO2 ≤ 12.3 ml/kg/min and 37% in those with peak VO2 > 12.3 ml/kg/min (log rank χ2: 72.86, p < 0.0001) (Fig. 3) and 77% in patients with VE/VCO2 slope ≥ 32.5 and 23% in those with VE/VCO2 slope < 32.5 (log rank χ2: 133.80, p < 0.0001) (Fig. 4).

Kaplan Meier analysis for 1-year cardiac-related mortality with VO2 peak threshold of 12.2.

Kaplan Meier analysis for 1-year cardiac-related mortality with VE/VCO2 slope threshold of 35.6.
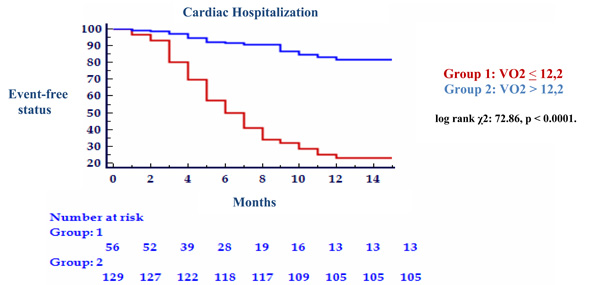
Kaplan Meier analysis for 1-year cardiac-related hospitalization with VO2 peak threshold of 12.2.
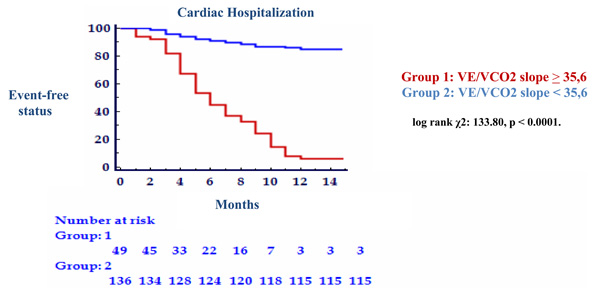
Kaplan Meier analysis for 1-year cardiac-related hospitalization with VE/VCO2 slope peak threshold of 35,6.
DISCUSSION
Beginning in the mid-1990s, consensus guidelines recommended the application of the CPET to supplement other clinical data in the management of patients with CHF. However, these guidelines limited their recommendations to the application of the peak VO2 achieved in the context of selecting patients for transplantation. Peak VO2 has been the most widely used parameter to predict survival and rehospitalization in patients with CHF [22]. The main disadvantage of peak VO2 is the need for maximal exercise, which may be difficult to achieve, particularly in CHF patients, whose daily activity levels are far below the effort required by the test. In addition, VO2 peak may be underestimated because of low patient motivation or because of premature termination of the test by the physician. A third potential limitation is the contribution peripheral metabolism has on VO2 peak. This contribution is made apparent with investigation demonstrating that high values for VO2 peak are paralleled by superior skeletal muscle metabolic capacity [23]. The prognostic role of VO2 peak is clear from these observations; however, an actual cut-off for decision probably does not exist. Although VO2 peak value < 14 ml/kg/min is recommended for selecting potential candidates for heart transplantation, since these patients had the worst prognosis [5], there is no distinct threshold in the 10-18 ml/kg/min range [6] which corresponds to an intermediate exercise capacity, the level reached by the majority of patients with CHF. We confirmed that a peak VO2 < 12.2 ml/kg/min signifies a worse prognosis than a higher peak VO2 in our population of patients with CHF. In fact, patients with a low VO2 peak (< 12.2 ml/kg/min) had a 1-year cardiac mortality of 66% and a 1-year cardiac hospitalization of 63%, while those exceeding this threshold had only 34% and 37% respectively.
After the ventilator response to exercise was confirmed as a significant prognostic marker [14-20], the VE/VCO2 slope seemed to be a strong candidate as a risk predictor in CHF even in those patients with intermediate exercise intolerance [16]. In our study, the VE/VCO2 slope manifests considerable prognostic value. Patients with VE/VCO2 slope ≥ 35.6 ml/kg/min revealed a 1-year cardiac-related mortality of 75% and a 1-year cardiac hospitalization of 77%, while those below this threshold had only 25% and 23% respectively. The ROC curve for VE/VcO2 slope to predict 1 year survival is similar in shape and area to that for peak VO2, implying equivalent prognostic power. The final result of our study, in agreement with other authors [14-20], was that VO2 peak and VE/VCO2 slope can be calculated to provide a risk surface for evaluating prognosis in CHF. There are several possible reasons why progressively higher VE/VCO2 slope might predict higher mortality and hospitalization across a range of peak VO2 value. Firstly, steepening of the VE/VCO2 slope is associated with reduced peak cardiac output and restrictive pattern of pulmonary dysfunction, an impairment mainly attributed to subclinical alveolar and interstitial pulmonary oedema [19]. Secondly, it may indicate enhanced ventilator reflex sensibility [24]. A third consideration is that the VE/VCO2 slope is computed using far more data than is peak VO2: it is accordingly less susceptible [25] to vagaries of CHF such as irregular breathing and early subjective fatigue which may sometimes interfere with determination of VO2 peak.
We chose to limit the tracking period to 1 year in the present investigation, since previous work by other group has demonstrated that the prognostic power of CPET variables begins to diminish over time [26]. Use of VO2 peak and VE/VCO2 slope to assess risk for cardiac-related mortality or cardiac-related hospitalization for one year period appears appropriate. Assessment of the risk using the VO2 peak and VE/VCO2 slope for longer tracking periods will result in an unacceptable decline in prognostic specificity. Numerous interventions, such as prescription of beta-blocking agents [3, 27] and aerobic exercise training [28], have been shown to reduce cardiac-related hospitalization rate in patients with CHF. Utilization of the VO2 peak and VE/VCO2 slope may be used to prompt clinicians to assess the current management of individuals deemed to be at high risk for hospitalization and alter care when appropriate.
LIMITATIONS OF THE STUDY
Although the large numbers of cardiac event were recorded during the tracking period, the relatively small sample size of the present study is a limitation. The fact that none of the subjects were NYHA class IV may also limit application of our findings to group with more severe CHF. Lastly, a number of previous studies have examined the impact beta-blockade on the prognostic characteristics of CPET variables, primarily peak VO2 [29, 30]. These studies have generally found that peak VO2 is still predictive of outcomes in patients receiving beta-blocking agent. Six-three percent of the subjects in the present study were prescribed a beta-blockers. Again the small overall sample size of the present study limited the ability to examine the influence of beta-blockade on the prognostic value of VE/VCO2 slope. Future research should investigate the impact of beta-blocker therapy on the prognostic value of VE/VCO2 slope as well as other CPET variables.
CONCLUSION
These results add to the present body of knowledge supporting the use of CPET in CHF patients. The VE/VCO2 slope, as an index of ventilatory response to exercise, is an excellent prognostic parameter and improves the risk stratification of CHF patients. It is easier to obtain than parameters of maximal exercise capacity and have similar prognostic importance than peak VO2.
ACKNOWLEDGMENTS
We thank Salvatore Milia, Raffaella Raimondi, and Massimo Sajeva for recruiting and helping to follow up the patients during the study.