All published articles of this journal are available on ScienceDirect.

Artificial Neural Networks Versus Multiple Logistic Regression to Predict 30-Day Mortality After Operations For Type A Ascending Aortic Dissection§
Authors Info & Affiliations
Abstract
Background:
There are few comparative reports on the overall accuracy of neural networks (NN), assessed only versus multiple logistic regression (LR), to predict events in cardiovascular surgery studies and none has been performed among acute aortic dissection (AAD) Type A patients.
Objectives:
We aimed at investigating the predictive potential of 30-day mortality by a large series of risk factors in AAD Type A patients comparing the overall performance of NN versus LR.
Methods:
We investigated 121 plus 87 AAD Type A patients consecutively operated during 7 years in two Centres. Forced and stepwise NN and LR solutions were obtained and compared, using receiver operating characteristic area under the curve (AUC) and their 95% confidence intervals (CI) and Gini’s coefficients. Both NN and LR models were re-applied to data from the second Centre to adhere to a methodological imperative with NN.
Results:
Forced LR solutions provided AUC 87.9±4.1% (CI: 80.7 to 93.2%) and 85.7±5.2% (CI: 78.5 to 91.1%) in the first and second Centre, respectively. Stepwise NN solution of the first Centre had AUC 90.5±3.7% (CI: 83.8 to 95.1%). The Gini’s coefficients for LR and NN stepwise solutions of the first Centre were 0.712 and 0.816, respectively. When the LR and NN stepwise solutions were re-applied to the second Centre data, Gini’s coefficients were, respectively, 0.761 and 0.850. Few predictors were selected in common by LR and NN models: the presence of pre-operative shock, intubation and neurological symptoms, immediate post-operative presence of dialysis in continuous and the quantity of post-operative bleeding in the first 24 h. The length of extracorporeal circulation, post-operative chronic renal failure and the year of surgery were specifically detected by NN.
Conclusions:
Different from the International Registry of AAD, operative and immediate post-operative factors were seen as potential predictors of short-term mortality. We report a higher overall predictive accuracy with NN than with LR. However, the list of potential risk factors to predict 30-day mortality after AAD Type A by NN model is not enlarged significantly.
INTRODUCTION
Acute aortic dissection (AAD) is a lethal condition requiring emergency surgical therapy, mainly replacing the ascending aorta and/or the aortic arch with or without aortic valve replacement [1]. Short-term mortality of medically treated patients after Type A dissection is high, peaking >50% in the first 48 hours following presentation [2]. In-hospital mortality of operated patients ranges 7-30% in recent series [1-11] and several factors have been considered to contribute to mortality risk [1, 2, 5-7, 11]. Among these, large lists of pre-operative and intra-operative factors have been studied [1-12]. The International Registry of AAD, collecting data from 18 referral centres worldwide identified a preoperative risk stratification scheme and a real average 25.1% figure for surgical mortality in AAD Type A in the current era by investigating 290 clinical variables and their relationship to surgical outcome in 526 of 1032 patients enrolled from 1996 to 2001 [2, 11]. Independent preoperative predictors of operative mortality were history of aortic valve replacement, migrating chest pain, hypotension as sign of AAD Type A, preoperative cardiac tamponade and preoperative limb ischemia [11]. In other investigations, techniques of surgical procedure have been considered among possible risk factors and the impact of retrograde, anterograde or selective cerebral perfusion after circulatory arrest was studied [3, 4, 7-9], although the results were not clear-cut to define the role of these as risk factors for short-term post-operative mortality.
When predictive modelling is used to challenge a very large database where a quantity of patients with a known outcome contributed a long list of variables, the overall predictive accuracy rarely exceeds 75% which has been repeatedly shown in the surgical domain by logistic regression (LR) based outcome predictive models after coronary artery bypass grafts (CABG) [13-15]. More recently, artificial neural networks (NN) were used for risk factor identification and mortality prediction in CABG surgery [16-18], aimed at ameliorating overall predictive accuracy in comparison to LR [18].
We investigated 121 patients consecutively operated during 7 years at a single Cardiac Surgical University Centre and run for the first time a NN model aimed at assessing the predictive potential of 30-day mortality by a large series of previously proposed risk factors, including surgical techniques, also comparing the performance of this model with standard LR results, using a well accepted metric [16, 17]. According to what has recently been reported with outcome predictive models following CABG surgery [18], NN model performance was comparatively better here than LR model performance. Moreover, when NN model was re-applied [19, 20] to data from a second Regional Hospital Centre where 87 patients were operated during a similar time period, there was a further increase in the performance. We therefore propose a list of potential risk factors to predict 30-day mortality after AAD Type A by NN model, tested on two independent series of patients, as methodology dictates in case of NN modelling, which now waits being confirmed also outside Italy for larger widespread use.
METHODS
Cohorts and Risk Factors
There were 121 patients undergoing surgical repair of AAD between January 2001 and early 2008 at the Cardiac Surgical Department of the University of Rome “La Sapienza”. Diagnosis was made in emergency with computer tomographic (CT) scan and/or trans-esophageal echocardiography. Anesthesia was induced by propofol (1-1.8 γ/ml) and sufentanil (0.35-1 γ/kg) and maintained by propofol 1-1.8 γ/ml/hr and sufentanil 0.35-0.51 γ/kg/hr. For each patient there were 37 potential predictors including demographic characteristics and pre-, operative and post-operative variables, selected by considering what had been previously analysed in the Literature (Table 1). However, for later inclusion in multivariable statistics, the criterion was that significant differences (p<0.05) by univariate analysis were seen in this patient series between dead patients and survivors at 30-day post-operation.
Potential Predictors of AAD Type A Investigated in the Literature Between 2000 and 2008
| Variables | 2000 Ref1 | 2000 Ref2 | 2000 Ref3§ | 2001 Ref4§ | 2004 Ref5 | 2006 Ref6 | 2006 Ref7 | 2008 Ref8§ | 2008 Ref9§ | Rome Study | P< |
|---|---|---|---|---|---|---|---|---|---|---|---|
| Demographic | |||||||||||
| Year of surgery | + | + | + | * | |||||||
| Age | + | + | + | + | + | + | + | + | + | * | |
| Sex | + | + | + | + | + | + | + | + | + | * | |
| NYHA class | + | + | |||||||||
| Pre-operative | |||||||||||
| Diabetes | + | + | + | ||||||||
| Atherosclerosis | + | + | |||||||||
| High blood pressare | + | + | + | + | + | + | + | * | |||
| Marfan syndrome | + | + | + | + | + | + | * | ||||
| Shock | + | + | + | + | + | + | * | ||||
| Syncope | + | + | |||||||||
| Intubated | + | + | * | ||||||||
| Pericardial effusion | + | + | |||||||||
| Pain | + | + | + | + | |||||||
| Pulselessness | + | + | |||||||||
| Neurological symptoms | + | + | + | * | |||||||
| Ischemic complications | + | + | + | ||||||||
| Onset symptoms | + | + | |||||||||
| Previous cardiac surgery | + | + | + | + | + | + | * | ||||
| Diagnosis | + | + | + | ||||||||
| Coronary artery disease | + | + | |||||||||
| COPD | + | + | |||||||||
| Ejection fraction | + | + | |||||||||
| Operative | |||||||||||
| Canulation site | + | + | + | + | + | ||||||
| Extracorporeal circulation (min) | + | + | + | + | * | ||||||
| Circulatory arrest (min) | + | + | + | + | * | ||||||
| Clamping time (min) | + | + | + | ||||||||
| Temperature (°C) | + | + | + | ||||||||
| Brain protection (coded) | + | + | + | + | * | ||||||
| Bicuspid aortic valve | + | + | * | ||||||||
| Aortic insufficiency | + | + | + | ||||||||
| Hemopericardium | + | + | * | ||||||||
| Type of surgery (coded) | + | + | + | + | + | + | + | * | |||
| Coronary bypass | + | + | + | ||||||||
| Aortic ropture | + | + | |||||||||
| Immediate Post-operative | |||||||||||
| Bleeding in the first 24 h (ml) | + | + | + | + | + | * | |||||
| Limb ischemia | + | * | |||||||||
| Renal complications | + | + | * | ||||||||
| Dialysis in continuous | + | + | + | * | |||||||
| Chronic renal failure | + | + | + | + | * | ||||||
| Enterological complications | + | + | + | * | |||||||
| Neurological deficits | + | + | + | + | + | + | + | * | |||
| Tracheosthomy | + | + | + | ||||||||
| Respiratory insufficiency | + | + | |||||||||
| Malperfusion syndrome | + | + | |||||||||
| Variables Studied (N) | 18 | 11 | 5 | 16 | 14 | 17 | 11 | 10 | 17 | 37 | 22 |
Table 1. Apart the variable named “limb ischemia”, only potential predictors considered by at least 2 Studies, including our own, were considered. AAD: ascending aortic dissection; COPD: chronic obstructive pulmonary disease.
§ marked references are technical reports rather than investigations purposely undertaken to assess the potential predictors of AAD Type A.
* p<0.05 when comparing 30-day post-operative deaths versus patients alive, by univariate analysis, after Type A acute aortic dissection among 121 patients operated at the University of Rome “La Sapienza”, Cardiac Surgical Department: of the 37 variables investigated in our own Study, 22 showed significant differences and were therefore considered for multivariate analyses.
Univariate Differences Between Survivors and 30-Day Post-Operative Deaths Following Type A Acute Aortic Dissection among 208 Patients Operated, Between 2001 and Early 2008, at the University of Rome “La Sapienza” or Sant’Anna Hospital, Cardiac Surgical Departments
| Covariates | Survivors (n=155) | 30-day Deaths# (n=53, 25.5%) | F | p< |
|---|---|---|---|---|
| Demographic | ||||
| Year of surgery | 2005±2 | 2005±2 | 1.37 | |
| Age (years) | 61±12 | 66±10 | 9.32 | ** |
| Sex (0=female; 1=male) | 0.63 | 0.66 | 0.10 | |
| Pre-operative | ||||
| High blood pressure | 0.86 | 0.84 | 0.15 | |
| Marfan syndrome | 0.07 | 0.05 | 0.45 | |
| Shock | 0.15 | 0.41 | 17.97 | *** |
| Intubated | 0.05 | 0.23 | 14.83 | ** |
| Neurological symptoms | 0.10 | 0.08 | 0.20 | |
| Previous cardiac surgery | 0.02 | 0.12 | 8.65 | * |
| Operative | ||||
| Extracorporeal circulation (min) | 199±57 | 248±111 | 17.31 | ** |
| Circulatory arrest (min) | 37±28 | 53±39 | 10.74 | ** |
| Brain protection (coded)a | 1.47±0.59 | 1.77±0.62 | 10.52 | ** |
| Bicuspid aortic valve | 0.03 | 0.02 | 0.21 | |
| Hemopericardium | 0.39 | 0.49 | 1.67 | |
| Type of surgery (coded)b | 3.43±2.47 | 3.64±2.30 | 0.31 | |
| Immediate Post-operative | ||||
| Bleeding in the first 24 hours (ml) | 976±817 | 765±964 | 2.55 | |
| Limb ischemia | 0.09 | 0.10 | 0.05 | |
| Renal complications | 0.17 | 0.38 | 10.85 | ** |
| Dialysis (continuous) | 0.11 | 0.33 | 15.38 | ** |
| Chronic renal failure | 0.01 | 0.20 | 30.13 | *** |
| Enterological complications | 0.03 | 0.08 | 3.14 | |
| Neurological deficits | 0.14 | 0.39 | 9.52 | * |
Table 2. Data are mean±standard deviation unless for discrete variables where only proportions are given.
# : rates were 33 of 121 (27,3%) and 20 of 87 (22.9%) in Rome and S. Anna Hospital, Catanzaro (NS), respectively.
F= values for the analysis of variance:
* :p<0.05;
** :p<0.01;
*** :p<0.001.
Forced (All Covariates Entered) Logistic Regression Model to Predict 30-Day Post-Operative Status after Type A Acute Aortic Dissection among 121 Patients Operated, Between 2001 and Early 2007, at the University of Rome “La Sapienza”, Cardiac Surgical Department
| Covariates | Mean ±SD | F | Coeff | SE | t | p= | OR | ±95%CI |
|---|---|---|---|---|---|---|---|---|
| Demographic | ||||||||
| Year of surgery | 2004±2 | * | -0.1016 | 0.1976 | -0.51 | 0.6071 | 0.90 | 0.61-1.33 |
| Age (years) | 63±11 | 0.0141 | 0.0313 | 0.45 | 0.6527 | 1.01 | 0.95-1.08 | |
| Sex (0=female; 1=male) | 0.67 | -0.4593 | 0.6420 | -0.71 | 0.4743 | 0.63 | 0.18-2.22 | |
| Pre-operative | ||||||||
| High blood pressure | 0.82 | -0.3895 | 0.8409 | -0.46 | 0.6432 | 0.67 | 0.13-3.52 | |
| Marfan syndrome | 0.03 | ** | -15.9883 | 975.2700 | -0.00 | 0.9869 | 0.00 | 0.00-0.00 |
| Shock | 0.15 | ** | 0.7515 | 0.9802 | 0.77 | 0.4433 | 2.12 | 0.31-14.47 |
| Intubated | 0.14 | 1.4199 | 1.0819 | 1.31 | 0.1894 | 4.13 | 0.50-34.48 | |
| Neurological symptoms | 0.14 | ** | -3.1865 | 1.7932 | -1.78 | 0.0756 | 0.04 | 0.00-1.39 |
| Previous cardiac surgery | 0.03 | 3.1338 | 1.3942 | 2.45 | 0.0246 | 22.96 | 1.49-352.95 | |
| Operative | ||||||||
| Extracorporeal circulation (min) | 211±81 | 0.0034 | 0.0032 | 1.06 | 0.2889 | 1.01 | 1.00-1.01 | |
| Circulatory arrest (min) | 53±34 | *** | 0.0078 | 0.0092 | 0.85 | 0.3965 | 1.01 | 0.99-1.03 |
| Brain protection (coded)a | 1.45±0.60 | ** | 1.0478 | 0.5210 | 2.01 | 0.0443 | 2.85 | 1.02-7.92 |
| Bicuspid aortic valve | 0.03 | -0.7811 | 1.7660 | -0.44 | 0.6583 | 0.46 | 0.01-14.59 | |
| Hemopericardium | 0.24 | *** | 0.7868 | 0.6535 | 1.20 | 0.2286 | 2.20 | 0.61-7.90 |
| Type of surgery (coded)b | 2.46±1.62 | *** | 0.0203 | 0.2025 | 0.10 | 0.9203 | 1.02 | 0.69-1.52 |
| Immediate Post-operative | ||||||||
| Bleeding in the first 24 hours (ml) | 1022±986 | * | 0.0000 | 0.0002 | 0.00 | 0.9871 | 1.00 | 0.99-1.00 |
| Limb ischemia | 0.14 | ** | -0.9928 | 1.1412 | -0.87 | 0.3843 | 0.37 | 0.04-3.47 |
| Renal complications | 0.26 | -16.3139 | 809.7974 | -0.02 | 0.9839 | 0.00 | 0.00-0.00 | |
| Dialysis in continuous | 0.25 | ** | 15.9259 | 809.7979 | 0.02 | 0.9843 | 0.00 | 0.00-0.00 |
| Chronic renal failure | 0.07 | 4.1363 | 1.5620 | 2.65 | 0.0080 | 62.57 | 2.93-1336.62 | |
| Enterological complications | 0.05 | 0.9715 | 1.6152 | 0.60 | 0.5475 | 2.64 | 0.11-62.63 | |
| Neurological deficits | 0.31 | ** | -0.0429 | 0.4881 | -0.09 | 0.9299 | 0.96 | 0.37-2.49 |
| Constant | 199.1009 | |||||||
Table 3. There were 120 patients with data complete for all 22 covariates considered and 33 were 30-day deaths (27.5%). The forced logistic model classified correctly 57.58% of patients who died and 91.95% of survivors (82.5% of overall cases were thus correctly classified) with a global chi-square equal to 50.56 (p<0.0005).
Only proportions are given when data are discrete. In case of continuous and coded covariates, summary statistics are given as mean±standard deviation (SD).
a : codes are 1 = retrograde; 2 = anterograde; 3 = anterograde and retrograde.
b : codes are 1 = ascending aorta; 2 = ascending aorta plus hemiarch; 3 = ascending aorta plus arch; 4 = ascending aorta plus aortic valve; or surgery according to: 5 = Bentall; 6 = Cabrol.
F= analysis of variance compared to data from Table 4:
* :p<0.05;
** :p<0.01;
*** :p<0.001; Coeff: logistic regression coefficient; SE= standard error; A value of t (coeff/SE) t>|1.96| was considered statistically significant (p<0.05). OR = odds ratio ± 95%CI (lower and upper 95% confidence limits).
Forced (All Covariates Entered) Logistic Regression Model to Predict 30-Day Post-Operative Status after Type A Acute Aortic Dissection among 87 Patients Operated, Between 2002 and Early 2008, at Sant’Anna Hospital, Cardiac Surgical Department
| Covariates | Mean ±SD | Coeff | SE | t | p= | OR | ±95%CI |
|---|---|---|---|---|---|---|---|
| Demographic | |||||||
| Year of surgery | 2005±2 | 0.1559 | 0.3548 | 0.44 | 0.6603 | 1.17 | 0.58-2.34 |
| Age (years) | 63±12 | -0.0183 | 0.0582 | -0.31 | 0.7534 | 0.98 | 0.88-1.10 |
| Sex (0=female; 1=male) | 0.60 | 0.0997 | 1.0592 | 0.09 | 0.9250 | 1.10 | 0.14-8.81 |
| Pre-operative | |||||||
| High blood pressure | 0.90 | -2.7545 | 1.7825 | -1.54 | 0.1223 | 0.07 | 0.00-2.09 |
| Marfan syndrome | 0.13 | -0.4687 | 1.7302 | -0.27 | 0.7865 | 0.63 | 0.02-18.59 |
| Shock | 0.33 | 3.5944 | 1.3587 | 2.64 | 0.0082 | 36.39 | 2.54-521.87 |
| Intubated | 0.06 | 79.9123 | 5007.2077 | 0.02 | 0.9873 | 0.00 | 0.00-0.00 |
| Neurological symptoms | 0.03 | -63.1073 | 4023.8080 | -0.02 | 0.9875 | 0.00 | 0.00-0.00 |
| Previous cardiac surgery | 0.07 | 17.2228 | 1389.1579 | 0.02 | 0.9901 | 0.00 | 0.00-0.00 |
| Operative | |||||||
| Extracorporeal circulation (min) | 216±76 | 0.0109 | 0.0071 | 1.54 | 0.1225 | 1.01 | 1.00-1.03 |
| Circulatory arrest (min) | 25±23 | -0.0278 | 0.0308 | -0.90 | 0.3667 | 0.97 | 0.92-1.03 |
| Brain protection (coded)a | 1.70±0.59 | -0.4011 | 0.8997 | -0.45 | 0.6557 | 0.67 | 0.11-3.90 |
| Bicuspid aortic valve | 0.01 | -16.4768 | 10209.3636 | -0.00 | 0.9987 | 0.00 | 0.00-0.00 |
| Hemopericardium | 0.68 | 1.5558 | 1.3749 | 1.13 | 0.2578 | 4.74 | 0.32-70.14 |
| Type of surgery (coded)b | 4.93±2.60 | 0.2358 | 0.2563 | 0.92 | 0.3576 | 1.027 | 0.77-2.09 |
| Immediate Post-operative | |||||||
| Bleeding in the first 24 hours (ml) | 768±638 | -0.0019 | 0.0012 | -1.58 | 0.1304 | 1.00 | 0.99-1.00 |
| Limb ischemia | 0.02 | -14.2374 | 7265.5683 | -0.02 | 0.9994 | 0.00 | 0.00-0.00 |
| Renal complications | 0.18 | -30.2771 | 2059.4766 | -0.01 | 0.9883 | 0.00 | 0.00-0.00 |
| Dialysis in continuous | 0.07 | 46.3386 | 3549.8350 | 0.01 | 0.9896 | 0.00 | 0.00-0.00 |
| Chronic renal failure | 0.05 | 49.2799 | 3570.6862 | 0.01 | 0.9890 | 0.00 | 0.00-0.00 |
| Enterological complications | 0.03 | -28.2509 | 11745.4953 | -0.00 | 0.9981 | 0.00 | 0.00-0.00 |
| Neurological deficits | 0.08 | 47.9856 | 2880.9335 | 0.02 | 0.9867 | 0.00 | 0.00-0.00 |
| Constant | -314.7065 | ||||||
Table 4. There were 87 patients with data complete for all 22 covariates considered and 20 were 30-day deaths (22.9%). The forced logistic model classified correctly 80% of patients who died and 100% of survivors (94.05% of overall cases were thus correctly classified) with a global chi-square equal to 70.23 (p<0.0001). Other specifications as in Table 3.
Thus, year of surgery, age, sex and NYHA class, presence of clinically diagnosed diabetes, atherosclerosis, high blood pressure and Marfan syndrome were considered. Moreover, among AAD onset symptoms we coded: shock, syncope, pericardial effusion, pain, pulselessness, and type and localization of ischemia. Whether intubation and hemodynamic instability were present at arrival or free blood was present in the pericardium were coded. Neurological deficits, main ischemic presentation, time delay from symptoms presentation (whether < or > 24 hours) and previous cardiac surgery were also coded. Among intra-operative coded variables there were: site of canulation, whether femoral vein or artery, right atrium and ascending aorta, right atrium and axillary artery by-pass, cross-clamping and total circulatory arrest time in min after extracorporeal perfusion started. Moreover, we coded whether cerebral perfusion was anterograde or retrograde and the temperature in Celsius degrees. Post-operative complications were noted for each patient and included: total bleeding in ml, limb ischemia, by clinical and CT documentation, renal complications, including oligo-anuria and continuous hemodialysis, gastrointestinal complications such as bleeding and ischemia, and other complication requiring medical or surgical treatment and cerebral accidents, neurological deficits and coma, by clinical and CT documentation. Finally, we considered total intubation time in min and whether tracheostomy occurred. For the definition of the analysed variables we followed those reported in previous studies [1-9] when available. Time and causes of death at 30-day following surgery were considered and if patients were alive at 720 hours after surgery they were censored.
There were also 87 patients undergoing surgical repair of AAD between January 2002 and early 2008 at the Cardiac Surgical Department of the Sant’Anna Hospital, Cardiac Surgical Department. Diagnosis was made in emergency with computer tomographic (CT) scan and/or transesophageal echocardiography and anesthesia was performed similarly. Covariates were obtained from this series of patients with superposable methods adopted for the Rome series.
Multivariable Statistics and Analysis
There are excellent recent books to have covered multiple logistic function analysis and its use to assess the relationship between covariates and events including mortality [21-25]. On the other hand, multilayers feed-forward networks were demonstrated by Hornik et al. with appropriate internal parameters (weights) to approximate an arbitrary nonlinear function [26]. Because prediction can be restated as a function approximation problem, it follows that artificial neural networks have the potential to solve major problems in a wide range of applications where their use has been reviewed to show advantages and disadvantages versus logistic regression for predicting medical outcomes [19, 20]. Dayhoff and De Leo [20] have recently reviewed what is inside the black box of neural network models in describing the most popular squashing function (also known as activation function) whereby the multilayered perceptron (MLP) actually operates (see Appendix 1 for further details).
With all modelling methods an important part is the selection (and the number) of prognostic variables to be included in the model. The selection may be done a priori based on previous knowledge, as it was done in the present investigation, to prevent the data driven method used more often that not, which leads to a different set of variables being selected each time [27]. Also the methods used to run the predictive models is important, since when covariates are numerous as in the present study, one may obtain not directly comparable solutions among different cohorts, if the selected procedure is stepwise.
Data are expressed as means ± ( SD or SE (when appropriate). Follow-up data, during 30 days, were investigated by modelling the presence (coded 1) or absence (coded 0) of post-operative mortality using logistic function [y=1/ (1+Exp(-1*coeff)] with all 22 explored covariates included (forced) in the model. NCSS software version 2007 (released August 14, 2007 by J Hintze, Kaysville, Utah; see www.ncss.com) and MedCalc software (version 9.6.3.0; see www.medcalcsoftware.com) were used. Although solutions were identical, the latter also calculates the area under the ROC curve (AUC) with 95% confidence intervals (CI) and makes comparisons by a well known method [28-33]. Tiberius Data Mining © software (version 5.4.3; see www.tiberius.biz) was used to obtain MLP neural network solutions. These were from a 3-layer network, including the hidden unit containing 2 neurons (one linear and the second non-linear), with 22 input nodes (corresponding to the 22 risk factors selected for logistic function solutions) and one output unit, modelling the dichotomous risk outcome (see Appendix 1). MLPs were trained on all patterns but preventing over-fitting [20]. The MLP output of Tiberius software consists of an Excel file where, for each of the cohort-specific individuals (apart from those with missing values) the following are calculated: modelled outcome, model error (versus actual outcome), calculated values for each neuron, a constant and a strength value based on a scale from -1 to +1, where 0 is a borderline case and +1 is the best true case and -1 is the best false case on the training data. The higher the absolute value of the strength, the stronger the classification. Fitted MLP after training were obtained for the Rome Center. Then the model was re-run on the Sant’Anna Hospital cohort data, running the procedure “predict/validate using a saved model on a new data set” as provided by Tiberius software. Corrado Gini’s coefficient and graph [34] were produced for both LR and NN models by Tiberius software. A Gini coefficient is the area under the diagonal and the curve whereas the AUC is the total area under an ROC. Therefore it is easy to obtain: AUC=(Gini*0.5)+0.5. AUC were compared between models and among solutions obtained from the 2 cohorts by MedCalc software. Tabulations of weights derived from trained MLP [35, 36] are not shown. A value of p<0.05 was considered statistically significant in all cases.
RESULTS
Table 2 shows univariate differences between survivors and 30-day post-operative deaths following AAD Type A among the grouped 208 patients operated in the 2 Centres of the present study. The comparison with Table 1 illustrates a frequent situation in the Literature whereby out of a series of 22 potential risk factors selected from a larger series of 37 assessed previously (Table 1), based on a significant criterion defined in one Centre, the simple merging of data with those from a second Centre, decreased the number of significant univariate potential predictors from 22 to 9.
Of the 208 overall patients operated in the 2 Centres (respectively Rome and Sant’Anna Hospital) between 2001 and early 2008, the most frequently interventions performed were those on ascending aorta (respectively 56 and 38 patients) followed by those on ascending aorta and aortic valve (respectively 21 and 11 patients), those on ascending aorta and hemiarch (respectively 15 and 7 patients) and those on ascending aorta and arch (respectively 10 and 12 patients). There were relatively few Cabrol (respectively 3 and 1 patients) as compared to Bentall (respectively 16 and 17 patients) surgery. There was a notable difference (see also Table 3 for the coded significant difference) between the 2 Centres in the proportion of anterograde brain perfusion performed (47 of 121 versus 67 of 87) versus the proportion of retrograde brain protection (respectively 73 of 121 versus 14 of 87). However, the duration of extracorporeal circulation was similar (respectively 211±81 versus 216±76 min) in spite of significantly shorter circulatory arrest time in Sant’Anna Hospital (25±23 min) than in Rome (53±34 min, p<0.001). On the other hand, 24-hour postoperative bleeding was only moderately higher in Rome (1022±986 ml) than in Sant’Anna Hospital (768±638 ml, p<0.05), which was unrelated to the type of intervention performed (data not shown). Table 3 also shows other slight differences between data obtained in the 2 Centres.
Tables 3 and 4 present respectively for the Rome and the Sant’Anna Hospital Centres, the forced LR results whereby the 22 potential factors were assessed to see which was a multivariable predictor of 30-day post-operative mortality. Interestingly enough, these tables show that the forced LR solutions did not present in the Rome and Sant’Anna Hospital Centres the same significant covariates to predict 30-day post-operative mortality. Thus in the Rome Centre, previous cardiac surgery (p=0.0246) and type of brain protection (anterograde vs retrograde: p=0.0443) were predictors whereas in the Sant’Anna Hospital Centre only the pre-operative presence of shock was a predictor (p=0.0082), respectively among 120 and 87 patients with complete data. The forced LR solution of Table 3 provided an AUC 87.9±4.1% with 95% CI from 80.7 to 93.2% which was not statistically different from the AUC obtained by the forced LR solution of Table 4 (85.7±5.2% with 95% CI from 78.5 to 91.1%).
By Tiberius software it was then ascertained whether stepwise solutions of LR or NN models might differ. Fig. (1) shows in a compact way that these predictive models do not select the same predictors neither are they ranked similarly. In fact, among significant predictors to be kept in stepwise solutions among the 120 AAD Type A operated patients from the Rome Centre, LR model selected in rank order: immediate post-operative presence of dialysis in continuous, renal complications, chronic renal failure, coded operative brain protection (anterograde better than retrograde perfusion), pre-operative neurological symptoms, age, previous cardiac surgery, the length of extracorporeal circulation, the operative presence of hemopericardium and post-operative enterological complications. On the other hand, NN model selected in rank order: immediate post-operative presence of chronic renal failure, coded operative brain protection (anterograde better than retrograde perfusion), post-operative presence of dialysis in continuous, pre-operative neurological symptoms, post-operative renal complications, the length of extracorporeal circulation, age, the operative presence of hemopericardium, pre-operative presence of intubation, post-operative limb ischemia and enterological complications and the year of surgery. There were 9 predictors selected by both models although with different rank order, whereas previous cardiac surgery was selected among significant stepwise predictors by LR only, and NN model detected the pre-operative presence of intubation, post-operative limb ischemia and the year of surgery as further significant predictors.

ROC plots are given in the top graphs, as derived from the Rome data, respectively by logistic and neural network models with a semiquantitative graphic presentation of the model-specific relevance of the covariates, always among Rome patients (training data). Keep=1 means the covariate may stay in the model. Note that Gini’s coefficients are 0.712 and 0.816 for logistic and neural network model, respectively.

ROC plots are given in the top graphs, as derived from the Rome models, respectively logistic and neural network. A semiquantitative graphic presentation is provided for Training/Validation data relevance when re-applied to S. Anna Hospital, Catanzaro (CZ) data. Keep=1 means the covariate may stay in the model. Note that Gini’s coefficients are 0.761 and 0.850 for logistic and neural network model, respectively, which is much better than what seen in Fig. (1).

Neural network’s diagram shows how the equations are related, indicating the inputs, outputs, and desired outputs which is intuitively easier to conceptualize compared with methods that involve equations alone.

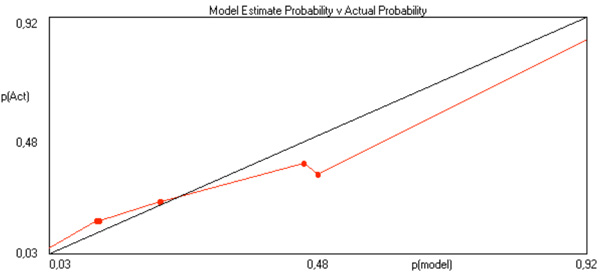
Model estimate probabilities calculated by Tiberius software versus actual probabilities for multiple logistic function.
Model estimate probabilities calculated by Tiberius software versus actual probabilities for multilayered perceptron.
Since out of the Rome Centre experience forced and stepwise LR solutions did select similar potential risk factors for 30-day mortality, and post-operative chronic renal failure was defined as a significant predictor by both forced LR and stepwise NN model, it was further ascertained whether the overall accuracies of these latter solutions might differ. There was no significant difference (p=0.553) between the AUC of the forced LR solution of Table 3 and the AUC obtained by the stepwise NN solution shown in Fig. (1) (90.5±3.7% with 95% CI from 83.8 to 95.1%). On the other hand, the Gini’s coefficients obtained from the Rome Centre data with stepwise models were different, the larger being by NN than LR model (0.816 versus 0.712). This means that using the 12 covariates selected by the stepwise NN model enabled a more accurate prediction of 30-day mortality, compared with that seen after the stepwise LR model selection which used 10 covariates, out of 22 covariates measured among 120 patients from the Rome Centre.
Fig. (2) shows the re-application to Sant’Anna Hospital data of the LR and NN models constructed on the Rome Centre data. LR model selected in rank order: immediate post-operative presence of dialysis in continuous, neurological deficits, pre-operative presence of intubation, the quantity of post-operative bleeding in the first 24 h, the presence of pre-operative shock and neurological symptoms. NN model selected in rank order: the presence of pre-operative shock, the length of extracorporeal circulation, post-operative chronic renal failure, the year of surgery, pre-operative presence of intubation, immediate post-operative presence of dialysis in continuous, the quantity of post-operative bleeding in the first 24 h, and the presence of pre-operative neurological symptoms. Interestingly, 5 predictors were selected by both models, when re-applied to Sant’Anna Hospital data, although with different rank order, whereas post-operative neurological deficits was presented among significant stepwise predictors by LR only, and NN model detected the length of extracorporeal circulation, post-operative chronic renal failure and the year of surgery as further significant predictors. Again, the Gini’s coefficients obtained from the Rome Centre model applied to Sant’Anna Hospital data with stepwise models were different, the largest being by NN (0.850 versus 0.761 of the LR re-applied model).
DISCUSSION
The incidence of AAD has been estimated at from 5 to 30 per million people per year in the United States, which is 880 to 147 times less than the incidence of acute myocardial infarction (AMI), but still provides an important clinical problem and sometimes a dilemma for the differentiating difficulties between these presentations [2]. In addition, since AAD and AMI advocate for very distinct therapeutic strategies, risk profiling may be important for the former and might rapidly dictate surgical treatment aimed at offering the chance of decreasing short-term mortality from as high as 58% in medically treated patients to the current average figure of 25.1% (and sometimes less) when surgery is performed [2]. The International Registry of AAD [2, 11] confirmed that patient selection plays an important role in determining surgical outcomes in patients with Type A presentation and that knowledge of significant risk factors for operative mortality may contribute to better management and a more defined risk assessment in affected patients. Indeed, the overall in-hospital mortality was as high as 31.4% in unstable patients categorized in presence of cardiac tamponade, shock, congestive heart failure, cerebro-vascular accident, stroke, coma, acute myocardial and/or mesenteric ischemia and acute renal failure at the time of operation, which contrasts with 16.7% in stable patients.
Nevertheless, it is important to underline that the global overall accuracy with the abovementioned series of covariates, explored by standard LR, while useful to define high risk individuals, was relatively unsatisfactory, similar to what seen in protocols investigating high risk in CABG surgery where ROC AUC around 0.75 or less were in general reported [13-15]. This prompted to look after different methods such as neural networks [16-18], which were however not previously, studied in AAD Type A patients.
We have analyzed a series of 22 demographic, pre-operative, operative and post-operative characteristics, selected from 37 such variables that previous investigations have considered (Table 1) as potential predictors of 30-day mortality after AAD Type A among 208 patients operated in 2 Italian Centres. By forced and stepwise LR model along with by stepwise NN model we defined several covariates which may help predict 30-day mortality among operated patients, depending on the model’s type and method and on the Centre where the patients were treated (Tables 3 and 4; Figs. 1 and 2). When models were produced in one Centre and applied in a second Centre there were predictors which were selected in common. These include (Fig. 2): the presence of pre-operative shock, intubation and neurological symptoms, immediate post-operative presence of dialysis in continuous and the quantity of post-operative bleeding in the first 24 h. By NN model, the length of extracorporeal circulation, post-operative chronic renal failure and the year of surgery were specifically detected. Our data confirm and extend the results of the International Registry of AAD [2, 11] since also operative and immediate post-operative factors were observed as potential predictors of short-term mortality. Furthermore, a quite accurate overall prediction was observed in our study, based on AUC and Gini’s coefficients results, pointing to the applicability of NN model prediction of post-operative mortality after AAD Type A, which extends the results obtained with this method in CABG surgery [16-19].
The predictive power of risk factors with multivariable models such as the multiple logistic function, the proportional hazards life table Cox model, the Poisson model, and the Weibull life table model, all of which are now standard methods [21-25], is an important aspect of risk stratification after surgery [14, 15]. More recently, other methods have arisen to perform multivariable predictions of bins, including multilayer feed-forward networks [26]. Artificial NN have become popular in medical applications [16-20], due to relatively widespread availability of free-, share-, and commercial-ware [see: http://neuralnetworks.ai-depot.com/Software.html] and the recent increase of personal computer power. There has been an effort to cope with the limitations of methods such as logistic regression [24], whose predictive accuracy rarely exceeded 75% when appropriately tested by ROC curves and comparisons [28-32], in the majority of epidemiological or clinical cardiovascular investigations [13-18, 36-41].
When the performance and/or reliability of predictive models is limited, or of low sensitivity and specificity, their capability may be hampered to identify high risk subjects who deserve individualized treatment [27]. The neural network method stems [19, 20] from its potential for improved predictive performance by exploring, hidden layers to find nonlinearities, interactions and nonlinear interactions among predictors. The attraction of neural networks is quite evident from the impressive growth of results published with these methods in the last 18 years [20]. However, there are relatively few comparative reports on the performance and accuracy of neural networks, which was assessed only versus multiple logistic function, to predict events in clinical [18] or epidemiological [36] cardiovascular studies and none has been performed on different populations once the respective predictive models were produced out of an index cohort, which may be seen as a critical deficiency [27].
What we have shown here for the first time is that a NN model was apt at assessing the 30-day mortality predictive potential of a large series of previously proposed risk factors [1,2,5-7,11], including surgical techniques, and this better than by standard LR, as far as the ROC AUC metric is concerned [16,17], similar to outcome reports after CABG surgery [13-18]. When NN model was re-applied to data from a second Regional Hospital Centre, which is a specific imperative of NN methodology [19, 20] that in a different context was not performed previously [18], there was a further increase in the performance. However, the list of potential risk factors to predict 30-day mortality after AAD Type A by NN model, tested on two independent and large series of patients, might be lacking of more sensitive factors, similar to The International Registry of AAD [2,11]. Among these, anatomo-surgical covariates [12] need certainly further study. Therefore, adoption of NN model and the list of predictive covariates selected here need a test outside Italy before larger widespread use.
Some limitations have to be considered here. Although we applied NN methodology of selecting a model in a first group of patients and then applied this into a second independent group of patients from the same nation-based population, both with similar 30-day mortality (Table 2 27.3 and 22.9% in Rome and Catanzaro, respectively), the overall 208 patients included in this investigation may represent a relatively small sample size. This calls for the assessment, among larger samples recruited in Italy or abroad, to confirm the reproducibility of our results. It might be important to extend the censoring from 30 to 90 days since several patients, alive by 30 days, may continue to vegetate in care centres, due to neurological damage. Whereas this may further cooperate to the validity of the predictive models to be then produced, no doubt that longer-term (1- to 5- year or more) survival prediction may also be important. However, it is at present unknown whether similar risk factor may apply as in case of short-term prediction. Finally, there might be different options to consider and take care of covariates, specifically those considered here as coded variables. However, whereas this may further extend the covariates number (which will demand a much larger sample to be studied), it is not clear, based on a preliminary but unreported evidence from these data, whether this is strictly needed for NN model to fit adequately.
In conclusion, an important take-home message for clinicians should be that with neural networks a globally more accurate prediction might be obtained, which deserves further study, although the list of potentially important predictive factors in AAD Type A patients is still elusive and more data from anatomo pathohysiological sources may probably still be needed and demand further investigations.
NOTES
§The Study was supported in part by Cardioricerca, Rome, Italy. Institutions where the work originated: University of Rome “La Sapienza”, Rome and Sant’Anna Hospital, Catanzaro, Italy.
ACKNOWLEDGMENTS
The cooperation of Dr Phil Brierley from NeuSolutions is acknowledged not only for having granted an Academic licence for Tiberius software, but also for suggestions and collaboration during the development of the analyses reported here.
APPENDIX 1
The most popular architecture currently adopted for artificial NN is the multilayered perceptron (MLP), which can be trained by back-propagation and typically is organized as a set of interconnected layers of artificial neurons. Each artificial neuron has an associated output activation level, which changes during the many computations that are performed during training. Each neuron receives inputs from multiple sources, and performs a weighted sum and a squashing function. Typically there are 3 layers of nodes, there are 2 layers of weights [20]. The weights on all the interconnections are initially set to be small random numbers and the artificial neural network is untrained at this stage. Then the network is presented with a training data set which provides inputs and desired (or known) outputs to the network. This is the stage whereby weights are adjusted in such a way that the likelihood the network will compute the desired output at its output level does increase. Therefore, training means many presentations of data to the neural network and the adjustment (often performed by a gradient descent computation) of its internal weights, until appropriate results are output from the network. This happens by searching a minimum error that can be attained during computations. After these error values are known, weights on the incoming connections to each output neuron then can be updated, which is proportional to a learning rate parameter used to update an error value for each hidden node [20].
It is quite clear that results with artificial neural networks depend on the data with which they are trained, to the extent that these methods are excellent at identifying and learning patterns that are in data. In more general terms, there have to be patterns present in the data before the neural network can learn the patterns successfully. If the data contain no predictive factors, then the neural network performance cannot be high. The informative content present in the data is accordingly a major limiting factor of artificial neural network performance. Under this perspective, these models represent a set of equations, linked together, through shared variables, in a format of interconnected nodes. Equations are not “new”, since they were in existence (like the sigmoid function) before they were labelled “neural networks”. What is important here is that the equations form a system with powerful and far-reaching learning capabilities, whereby complex relations (especially when the inputs are numerous) can be learned during training and recalled later with different data, possessing however a comparable general structure. Moreover, the network’s diagram, such as shown in Fig. (3) may show how those equations are related, indicating the inputs, outputs, and desired outputs and intuitively is easier to conceptualize compared with methods that involve equations alone [20].
Although tabulations of weights derived from trained MLP have been occasionally published [35,36], these weights are not immediately as useful as are regression coefficients in case of logistic models. This is due to the difficulties of immediate weight re-application and the complexity of formulae needed to calculate risk [36], which is instead mathematically easy with multiple logistic function whereby logit transform enables risk calculations [21-24]. With NN a cross entropy error function to adjust the weights and to minimize the network fit criterion has been used by Voss et al. [36]. The cross entropy function can be derived from the likelihood of the underlying Bernoulli distribution of the entire training set and it is specially designed for classification problems, in combination with the logistic activation function which maps all its arguments to values between 0 and 1, in the output layer of the network, yet being cumbersome to calculate.
With Tiberius software, model estimate probabilities are calculated versus actual probabilities, which is exemplified in Figs. (4 and 5), respectively for multiple logistic function and for MLP. These graphs relate to post-operative mortality risk in 30 days among 120 patients with complete data out after AAD Type A in the Rome Centre. To exemplify how does this software operates, here are the codes and a summary report, whereby the relative importance of each risk factor might be evaluated:
This SAS® code is a neural network with tanh hidden units and a logistic output unit.
*/
/* normalise variables */
var_1 = 2.0 * ((Annint - 2001,0) / (2007,0 - 2001,0) - 0.5) ;
var_2 = 2.0 * ((Age - 36,0) / (84,0 - 36,0) - 0.5) ;
var_3 = PoTOT_0_ ;
var_4 = PoDN_0_ ;
var_5 = 2.0 * ((TCEC - 24,0) / (682,0 - 24,0) - 0.5) ;
var_6 = 2.0 * ((PerBR - 1,0) / (3,0 - 1,0) - 0.5) ;
var_7 = 2.0 * ((HP - 0,0) / (1,0 - 0,0) - 0.5) ;
var_8 = 2.0 * ((IscL - 0,0) / (1,0 - 0,0) - 0.5) ;
var_9 = 2.0 * ((Cren - 0,0) / (1,0 - 0,0) - 0.5) ;
var_10 = Cvvh_Missing ;
var_11 = 2.0 * ((Cvvh - 0,0) / (1,0 - 0,0) - 0.5) ;
var_12 = 2.0 * ((IRC - 0,0) / (1,0 - 0,0) - 0.5) ;
var_13 = 2.0 * ((Cint - 0,0) / (1,0 - 0,0) - 0.5) ;
var_14 = DN_Missing ;
/* logistic neural net */
coeff =
-0,71746772444572
+
(tanh(-1,03378999611555 +
(var_1 * -0,122396259300735) +
(var_2 * -1,08891152847242) +
(var_3 * 2,56914360487484) +
(var_4 * -2,95929882538653) +
(var_5 * -1,63217880467112) +
(var_6 * 0,184137494160511) +
(var_7 * -0,328420046906812) +
(var_8 * -0,357489898481089) +
(var_9 * 1,30026233578302) +
(var_10 * -1,19387587038731) +
(var_11 * -0,219295729085299) +
(var_12 * -1,92345769540069) +
(var_13 * 0,343212977003628) +
(var_14 * -1,30537814371111)
) * -0,854296015154336)
+
(tanh(1,18706945329681 +
(var_1 * -0,921782211205017) +
(var_2 * 1,60855837301232) +
(var_3 * 1,66480319629646) +
(var_4 * 2,94832098096511) +
(var_5 * 2,79703317268372) +
(var_6 * 3,25890038252281) +
(var_7 * 1,21715272855026) +
(var_8 * -2,05399109642943) +
(var_9 * -0,715935246925439) +
(var_10 * 1,7007972826595) +
(var_11 * 1,86063852463387) +
(var_12 * 3,16591755002935) +
(var_13 * 1,22926857839774) +
(var_14 * 1,91695213087242)
) * 1,31269499306821)
;
coeff = coeff * 1,5607729965579 ;
Prob_Status = 1 / (1 + Exp(-1 * coeff));
RUN ;
DATA SUMMARY
----------------------------------
Generation Date:
giovedì, 9 ott 2008, 1.09.52
Data Source:
C:\Macrina\disRM.xls
Table:
Foglio1$
Target:
Status
True = 1
False = 0
Prob = count(True) / [count(True) + count(False)]
Filter:
None
TRAIN/VALIDATION BREAKDOWN
------------------------------------------
Training patterns = 124 (100%) Gini = 0,81609 RMS Error = 0,30970
VARIABLE IMPORTANCE
------------------------------------------
The average model gini when the input is randomised 3 times (see options menu to vary this setting).
| Rank | Gini | Variable |
| 1 | 0,57275 | IRC |
| 2 | 0,61665 | PerBR |
| 3 | 0,63985 | Cvvh |
| 4 | 0,68852 | PoDN_0_ |
| 5 | 0,69204 | Cren |
| 6 | 0,70757 | TCEC |
| 7 | 0,71523 | Age |
| 8 | 0,72062 | HP |
| 9 | 0,74443 | PoTOT_0_ |
| 10 | 0,76162 | IscL |
| 11 | 0,77695 | Cint |
| 12 | 0,78523 | Annint |
| 13 | 0,79207 | DN_Missing |
| 14 | 0,80325 | Cvvh_Missing |
We will provide, on request, cohort-specific and/or grouped html files whereby the individual 30-day post-operative mortality risk after AAD Type A intervention may be calculated based on NN models and risk factors values digitized in the ranges of those measured in the cohorts whereby the models were obtained.