All published articles of this journal are available on ScienceDirect.

The Incremental Value of Troponin Biomarkers in Risk Stratification of Acute Coronary Syndromes: Is the Relationship Multiplicative?
Abstract
Structured Abstract
Objective:
To emphasize the importance of troponin in the context of a new score for risk stratifying acute coronary syndromes (ACS) patients. Although troponins have powerful prognostic value, current ACS scores do not fully capitalize this prognostic ability. Here, we weigh troponin status in a multiplicative manner to develop the TRACS score from previously published Rush score risk factors (RRF).
Methods:
2,866 ACS patients (46.7% troponin positive) from 9 centers comprising the TRACS registry, were randomly split into derivation (n=1,422) and validation (n=1,444) cohorts. In the derivation sample, RRF sum was multiplied by 3 if troponins were positive to yield the TRACS score, which was grouped into five categories of 0-2, 3-5, 6-8, 9-11, 12-15 (multiples of 3). Predictive performance of this score to predict hospital death was ascertained in the validation sample.
Results:
The TRACS score had ROC AUC of 0.71 in the validation cohort. Logistic regression, Kaplan-Meier analysis, likelihood-ratio and Bayesian Information Criterion (BIC) test indicated that weighing troponin status with 3 in the TRACS score improved the prediction of mortality. Hosmer-Lemeshow test indicated sound model fit.
Conclusions:
We demonstrate that weighing troponin as a multiple of 3 yields robust prognostication of hospital mortality in ACS patients, when used in the context of the TRACS score.
INTRODUCTION
The ACC/AHA guidelines recommend accurate risk stratification of chest pain patients for initiating evidence-based therapies in the management of acute coronary syndromes (ACS) [1]. Risk stratification is achieved by using the various published risk scores and by clinical assessment. Troponin biomarkers represent an important part of the clinical assessment. They are widely used and are powerful prognostic predictors of adverse events in ACS syndromes. However, current risk stratification models like the Thrombolysis in Myocardial Infarction (TIMI) score, which though is simple to use may underestimate the predictive ability of powerful predictors like troponin biomarkers [2-4]. Accurate risk stratification is particularly important when stronger risk factor variables like troponin are present, but weaker ones are absent to give a low or intermediate score.
Another example of a risk prediction model in ACS is the Rush score [5-7]. It has a sound pathophysiologic basis that originates from Braunwald’s unstable angina classification [5-7]. The Rush score, developed from registry data, is a regression-weight based, validated instrument predicting mortality in ACS patients, but does not use troponin status [5-7]. In contrast, troponin biomarkers form an important component of most risk stratification models like the TIMI [8] and Global Registry of Acute Coronary Events (GRACE) [9] risk models.
We sought to increase the predictive performance of the Rush risk score, by first exploring the relationship between the Rush risk factors and troponin biomarkers and then incorporating troponin into the Rush risk factors as an additional component of this score. The rationale for selecting the Rush score for modification was that it is consists of easily ascertainable risk factors, is simple to use and it is one of the few scores that still do not use troponin. We use The Registry of Acute Coronary Syndromes (TRACS registry) for model development and validation.
METHODS
Study Population
The Registry of Acute Coronary Syndromes (TRACS) consists of patients presenting with ACS to 9 participating hospitals, including tertiary medical centers and community hospitals. Consecutive patients meeting the predefined criteria for ACS based on the International Classification of Disease (ICD) code (410.X) and who were seen in the emergency department at these centers for evaluation of chest pain between April 1, 1999, and December 31, 2000, were enrolled in TRACS (n=3,468 patients). All data were retrieved by a retrospective chart audit that was supervised by a designated physician at the participating center. Patients with the ICD code (410.X) criteria for ACS underwent EKG evaluation and three serial blood draws for cardiac biomarkers. After arrival in the ED, the mean time(s) elapsed until the first troponin was 5.7 hours, the second troponin was 11.8 hours and third troponin was18.6 hours respectively. A positive troponin was defined as a troponin value above the reference range at the participating center. For participating centers this included a value of > 0.5 ng/ml for the troponin I assay, and ≥ 0.02 ng/ml when the troponin T assay was used. The TRACS dataset did not include the magnitude of the troponin level, but only a dichotomous variable of troponin status. All participating hospitals received approval for this study from their institutional review boards.
The TRACS database included 602 patients with ST elevation MI. These were excluded and the resulting 2,866 patients were split randomly into two samples – a derivation sample (n= 1422, 49.6%) and a validation sample (n = 1444, 50.4%) using the random function STATA command “sample” which draws random samples from the data. Random sampling here was defined as drawing observations without replacement.
We used the derivation sample for developing the TRACS score by modifying the previously published Rush score [5]. The Rush score is a regression-based score derived from the original Braunwald classification of unstable angina and hence does not use troponin as a risk factor [5,10]. It has a sound pathophysiologic basis and has been prospectively validated [7]. It consists of (scores in parenthesis): (1) MI in the past 14 days (score 6), (2) not using β blockers as an outpatient medication (score 4), (3) ST depression (score 3), (4) ongoing chest pain (score 2), (5) diabetes (score 2), and (6) age (score 2 if age >75 years; score 1 if age <65-75 years). The sum of these scores determines the Rush score. We modified it to develop the TRACS score as follows:
First, the TRACS score only assigns a single point to the above variables that results in a simple sum of Rush risk factors (RRF sum) (not regression weights; this strategy is identical to that of the TIMI score). Secondly, we incorporated troponin elevation to the RRF sum in a multiplicative (rather than additive) manner as follows: It is well established that troponin elevation adds independent value to risk stratification [11-13]. This assumption was confirmed here with a logistic regression model where the dependent variable was hospital mortality and the two independent variables were troponin elevation (OR 2.88, p = 0.007) and the RRF sum (OR 1.46, p = 0.047). The weight of troponin elevation was rounded up to 3 (from 2.88) and multiplied with the RRF sum to yield the TRACS score:
TRACS Score = Sum of Rush Score Variables × 3 (if Troponin Positive)
In troponin negative patients, only the RRF sum was used. The TRACS score ranged from 0-15 and had an exponential distribution (Fig. 1) because of the above multiplicative function. For simplicity of use, the TRACS score was grouped into five categories of scores of 0-2, 3-5, 6-8, 9-11 and 12-15. This categorization was based on dividing patients by a multiple of three. As seen here, each category score is roughly double the previous category and this is consistent with the exponential nature of the TRACS score (which occurs due to multiplication by 3).
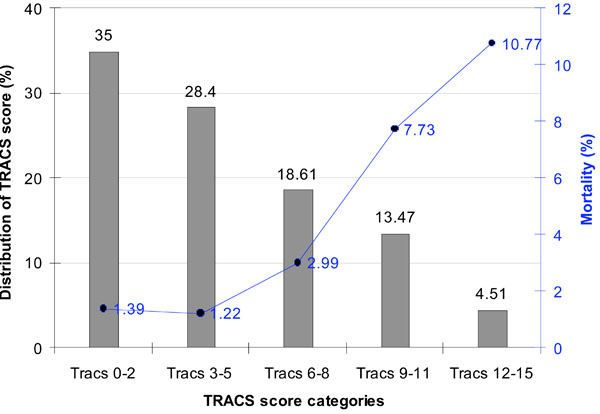
Distribution of the TRACS score and observed mortality by the TRACS score categories in the validation cohort.
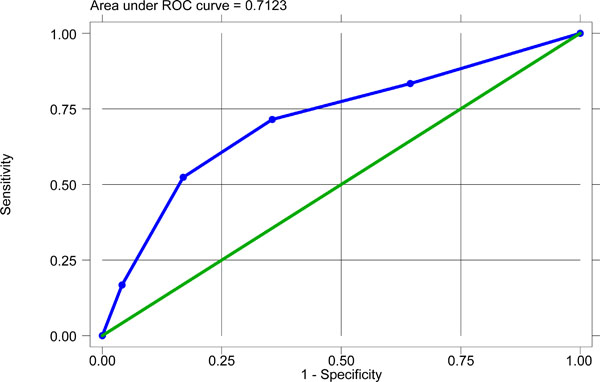
Receiver operating characteristic (ROC) curve for the TRACS score in the validation cohort.
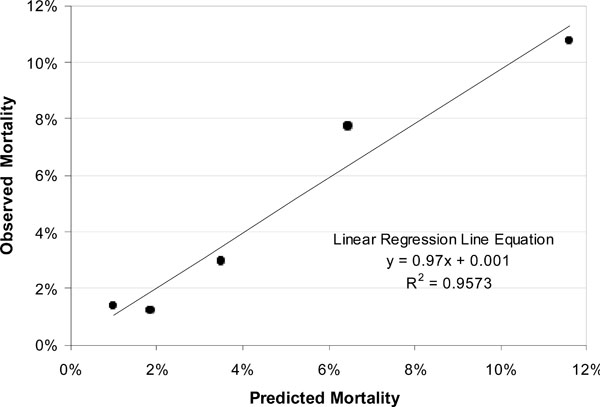
Model Calibration of both TRACS score in the validation cohort.
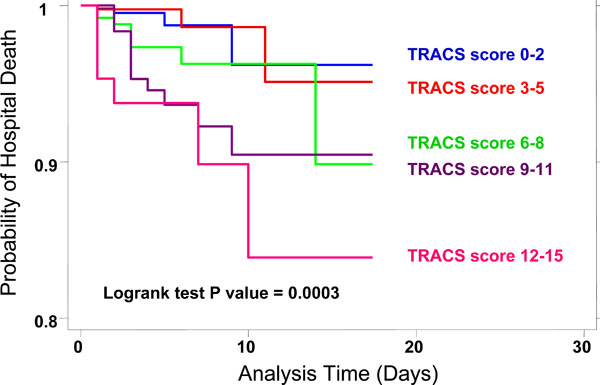
Kaplan Meier survival analysis for the TRACS score.
TRACS score category 1 (score 0-2) represented patients who were troponin negative and had 1-2 Rush score risk factors, TRACS score category 2 (score 3-5) had both troponin positive (with only1 Rush risk factor) and negative patients (with 3-5 Rush risk factors) while TRACS score categories 3 (score 6-8), 4 (score (9-11) and 5 (score 12-15) represented the troponin positive patients with 2, 3 and 4-5 Rush score risk factors, respectively (Table 1). Thus the TRACS score does not consider troponin as a ‘risk factor’, but moves up its importance as an entirely separate domain in risk stratification. Troponin positive patients get higher TRACS score ranks, via application of a multiplicative function of 3 to incorporate the robust prognostic value of troponin into the Rush score variables.
Frequency Distribution (%) of the Sum of Rush Risk Factor Variables by Troponin Status in the Derivation Cohort
| Troponin Negative | Troponin Positive | |||||||||
|---|---|---|---|---|---|---|---|---|---|---|
| Rush Risk Factors → | 1 | 2 | 3 | 4 | 5 | 1 | 2 | 3 | 4 | 5 |
| TRACS Score Categories | ||||||||||
| Score 0-2 | 164 | 328 | ||||||||
| Score 3-5 | 186 | 56 | 3 | 144 | ||||||
| Score 6-8 | 281 | |||||||||
| Score 9-11 | 206 | |||||||||
| Score 12-15 | 49 | 5 | ||||||||
In-Hospital Mortality by Troponin Status and Sum of Rush Risk Factors in the Derivation Cohort
| Rush Score Risk Factors Sum | Troponin Negative pts | Troponin Positive pts | Total | ||
|---|---|---|---|---|---|
| N | Death (%) | N | Death (%) | ||
| 1 | 164 | 0.61 | 143 | 0 | 307 |
| 2 | 328 | 1.83 | 281 | 3.56 | 609 |
| 3 | 186 | 1.08 | 206 | 5.34 | 392 |
| 4 | 56 | 0 | 49 | 6.12 | 105 |
| 5 | 3 | 0 | 5 | 0 | 8 |
| Total | 737 | 1.22 | 684 | 3.51 | 1,421 |
Study Characteristics of Patients in the Derivation and Validation Cohorts of the TRACS Registry
| Derivation Cohort | Validation Cohort | Total | P value | |||
|---|---|---|---|---|---|---|
| N | Percent | N | Percent | |||
| Demographics and Risk Factors | ||||||
| Mean age | 66.9±13.5 | 67.0±13.5 | ||||
| Male gender | 848 | 60 | 861 | 60 | 1709 | 0.937 |
| Diabetes | 437 | 31 | 440 | 30 | 877 | 0.880 |
| Known history of CAD | 712 | 50 | 713 | 49 | 1425 | 0.710 |
| Family history | 262 | 18 | 261 | 18 | 523 | 0.808 |
| Hypercholesterolemia | 879 | 62 | 883 | 61 | 1762 | 0.715 |
| Past myocardial infarction > 2 weeks | 420 | 30 | 383 | 27 | 803 | 0.073 |
| Recent myocardial infarction ≤ 2 weeks (re-infarction or post-infarct angina) | 63 | 4 | 65 | 5 | 128 | 0.927 |
| Race | 0.305 | |||||
| Asian | 4 | 0 | 2 | 0 | 6 | |
| Black | 121 | 9 | 149 | 10 | 270 | |
| Caucasian | 1170 | 82 | 1159 | 80 | 2329 | |
| Hispanic | 48 | 3 | 37 | 3 | 85 | |
| Race not available | 6 | 0 | 5 | 0 | 11 | |
| Not abstracted | 35 | 2 | 38 | 3 | 73 | |
| Others | 38 | 3 | 52 | 3 | 90 | |
| Risk Stratification and Acuity of Presentation Variables | ||||||
| Unstable angina | 737 | 52 | 790 | 55 | 1527 | 0.122 |
| Non-STEMI | 685 | 48 | 654 | 45 | 1339 | 0.122 |
| Mean TIMI score | 3.7 ± 1.1 | 3.7 ± 1.1 | 0.685 | |||
| TIMI score risk factors distribution | 0.511 | |||||
| 1 | 32 | 2 | 36 | 2 | 68 | |
| 2 | 171 | 12 | 185 | 13 | 356 | |
| 3 | 434 | 31 | 407 | 28 | 841 | |
| 4 | 443 | 31 | 490 | 34 | 933 | |
| 5 | 266 | 19 | 256 | 18 | 522 | |
| 6 | 70 | 5 | 61 | 4 | 131 | |
| 7 | 6 | 0 | 9 | 1 | 15 | |
| Mean Rush score risk factors sum | 2.2 ± 2.1 | 2.3 ± 2.2 | 0.147 | |||
| Distribution of Rush score risk factors sum | 0.666 | |||||
| 1 | 308 | 22 | 290 | 20 | 598 | |
| 2 | 609 | 43 | 611 | 42 | 1220 | |
| 3 | 392 | 28 | 415 | 29 | 807 | |
| 4 | 105 | 7 | 116 | 8 | 221 | |
| 5 | 8 | 1 | 12 | 1 | 20 | |
| Mean TRACS score (raw score) | 4.4 ± 3.0 | 4.4 ± 3.1 | 0.818 | |||
| Mean TRACS score categories (1 to 5) | 3.8 ± 3.6 | 3.7 ± 3.6 | 0.724 | |||
| Distribution of TRACS score categories | 0.702 | |||||
| TRACS category 1: 0-2 | 492 | 35 | 507 | 35 | 999 | |
| TRACS category 1: 3-5 | 389 | 27 | 409 | 28 | 798 | |
| TRACS category 1: 6-8 | 281 | 20 | 268 | 19 | 549 | |
| TRACS category 1: 9-11 | 206 | 14 | 195 | 14 | 401 | |
| TRACS category 1: 12-15 | 54 | 4 | 65 | 5 | 119 | |
| Troponin Variables | ||||||
| First troponin positive | 486 | 34 | 464 | 32 | 950 | 0.130 |
| SeSecond troponin positive | 572 | 40 | 545 | 38 | 1117 | 0.276 |
| Third troponin positive | 514 | 36 | 464 | 32 | 978 | 0.069 |
| Any troponin positive | 685 | 48 | 654 | 45 | 1339 | 0.122 |
| EKG Variables | ||||||
| EKG LBBB | 69 | 5 | 56 | 4 | 125 | 0.202 |
| EKG non-specific ST-T abnormalities | 50 | 4 | 52 | 4 | 102 | 0.0.902 |
| EKG LVH | 34 | 2 | 33 | 2 | 67 | 0.851 |
| EKG ST depression | 192 | 14 | 255 | 18 | 447 | 0.002 |
| Any EKG Abnormality | 351 | 25 | 350 | 24 | 701 | 0.782 |
| Outcome | ||||||
| In-hospital mortality | 33 | 2.3 | 42 | 2.9 | 75 | 0.320 |
Predictive Performance of the TRACS Score in Clinically Relevant Patient Subgroups in the Validation Cohort
| Subgroup | N | ROC AUC | 95% CI |
|---|---|---|---|
| Diabetes | 439 | 0.7573 | 0.63 - 0.88 |
| Age ≥ 65 | 850 | 0.6585 | 0.56 - 0.75 |
| Male | 859 | 0.7265 | 0.60 - 0.86 |
| Female | 552 | 0.7110 | 0.60 - 0.82 |
| Troponin positive pts | 653 | 0.7137 | 0.64 - 0.79 |
| Pts with known CAD or past MI | 980 | 0.7518 | 0.64 - 0.87 |
| EKG ischemia (ST depression) | 255 | 0.7161 | 0.59 - 0.84 |
| By TIMI Score Category Subgroups | |||
| Low TIMI score (1-3) | 625 | 0.6912 | 0.53 – 0.85 |
| Intermediate TIMI score (4-5) | 745 | 0.6732 | 0.55 – 0.79 |
| High TIMI score (6-7) | 70 | 0.7268 | 0.56 – 0.89 |
Multivariable Logistic Regression Analysis Incorporating TRACS Score in the Validation Cohort
| Variables | Odds Ratio | P value | 95% CI |
|---|---|---|---|
| Score Variables | |||
| Rush risk factors sum | 0.65 | 0.52 | 0.18 - 2.41 |
| TRACS score (per incremental point 0 to 5) | 1.14 | 0.03 | 1.01 - 1.28 |
| Risk Factor Variables | |||
| Age ≥ 65 | 4.30 | 0.07 | 0.88 - 20.96 |
| Male gender | 0.92 | 0.81 | 0.47 - 1.79 |
| Diabetes | 1.16 | 0.84 | 0.27 - 5.03 |
| Hypercholesterolemia | 1.27 | 0.50 | 0.63 - 2.54 |
| EKG Ischemia (ST depression) | 3.04 | 0.11 | 0.78 - 11.88 |
| Therapy Variables | |||
| Aspirin use | 0.38 | 0.01 | 0.18 - 0.81 |
| Heparin use | 1.53 | 0.35 | 0.63 - 3.73 |
| Glycoprotein IIb/IIIa antagonist use | 0.75 | 0.55 | 0.30 - 1.91 |
| Beta blocker use | 0.37 | 0.18 | 0.09 - 1.59 |
| Nitroglycer in use | 0.22 | 0.00 | 0.11 - 0.44 |
| Revascularization (PCI or CABG) | 0.44 | 0.06 | 0.19 - 1.02 |
Some generalizations were made while calculating these scores. All patients by inclusion criteria had chest pain on admission and were coded to have ‘ongoing chest pain’. For the TRACS score patients ≥ 65 years of age were assigned one point, while the original Rush score gives 1 point for patients between 65-75 years and 2 points for patients ≥ 75 years. None of the patients had all 6 Rush score risk factors in this dataset.
Statistical Analyses
The data are presented as frequency or mean ± SD. Characteristics were compared across groups with χ2 tests for categorical variables and t tests for continuous variables. The outcome was hospital death.
For testing the validity of the TRACS score, the method of split-sample validation was used. We randomly split the 2,688 patients into a derivation sample and a validation sample. The predictive performance of the TRACS score was ascertained in the validation sample as follows: The prognostic ability of the TRACS score was measured and compared with the c-statistic representing the area under the receiver operating characteristic (ROC) curves (AUC) for prediction of hospital death. A c-statistic > 0.70 was considered to have good discriminatory ability. ROC analyses were also done across various sub-groups of patients, to see if the score was robust in any particular sub-groups. Multivariable logistic regression was used to predict death from other covariates including the TRACS score. Model calibration of the TRACS score was tested with the Hosmer and Lemeshow goodness-of-fit test and by plotting the observed versus expected mortality in the subgroups of TRACS score [14]. Likelihood-ratio testing was performed to ascertain the contribution of the troponin in the TRACS score over and beyond the Rush risk factors, towards prediction of hospital mortality. The Bayesian counterpart of this - the Bayesian Information Criterion (BIC) difference methodology - that overcomes the drawbacks of likelihood-ratio testing was also used. BIC was developed by Schwartz [15] and modified by Raftery [16]. The BIC difference methodology uses the BIC of two nested models to estimate the BIC difference and then evaluates which model would be more likely (the “true” model) – before or after dropping one of the explanatory variables (here the TRACS score). The BIC difference is a rigorous test of comparison between the likelihood of two models: the original model and the model without one of the variables and ascertains whether the "true" model contains the variable in question.
Finally, Kaplan Meier survival analyses and Cox proportional hazards regression were used to analyze survival in the TRACS score categories as a function of time. Hospital stay in days was the time variable, while in-hospital death was the failure event. The log rank test was used to test the equality of survival distributions. Stata version 8.2 (StataCorp, College Station, TX) was used to analyze the data.
RESULTS
Baseline characteristics of the TRACS registry population across the derivation and validation cohorts is shown in Table 3. The population mostly comprised of elderly, white, male patients with a high prevalence of diabetes, known CAD and hyperlipidemia, who were high risk, mostly non-ST segment myocardial infarction (NSTEMI) and unstable angina patients. There were no major differences between the randomly split derivation and validation cohorts (Table 3).
Of the total 2,866 patients, troponin biomarkers were positive in 1,339 (46.7%) patients, who were classified as having a NSTEMI. Of these NSTEMI patients, 950 (33.2%) patients had a first positive troponin on arrival in the emergency department, while the remainder 389 (13.6%) patients initially were troponin negative, but subsequently on repeat testing 6 hours and 12 hours apart, turned positive. The troponin negative patients (n= 1,527, 53.3%) were classified as having unstable angina. Of the 2,866 patients, the primary end-point of hospital mortality occurred in 75 (2.62 %) patients. The mean number of Rush risk factors were 2.24 ± 0.89 in the entire sample. Table 2 displays the in-hospital mortality by troponin status and sum of Rush risk factors in the derivation cohort.
Fig. (1) shows the distribution of the TRACS score and deaths (%) in each score sub-groups in the validation sample. A steep increase in mortality was seen with increase in TRACS score category. The TRACS score showed a good discriminatory ability for predicting in-hospital mortality.
ROC analysis demonstrated that area under the curve (AUC) was 0.7123 (95% CI 0.62-0.79) (Fig. 2). This was a significant improvement over the ROC AUC of the sum of Rush risk factors alone (AUC 0.6517, 95% CI 0.60-0.70). ROC analyses also showed a high predictive ability of the TRACS score in the sub-groups of diabetes, age ≥65, those with CAD, and troponin positivity (Table 4). We also calculated the TIMI score as described previously [8]. When ROC analyses were repeated for the predictive ability of the TRACS score across the traditional categories of TIMI score: low risk (TIMI score 0-3), intermediate risk (TIMI score 4-5) and high risk (TIMI score 6-7), the TRACS score had good discriminatory ability across all three traditional TIMI risk groups. It was reasonably good in the intermediate risk category of the TIMI score; an area where the clinician faces the most difficulty in risk stratification, and use of a separate score here shows statistical evidence of good predictive performance.
By univariate logistic regression analyses, the TRACS score categories were strongly predictive of death (OR per incremental category (0 to 5) was 1.24, 95%CI 1.14 – 1.34, p value <0.001). Hosmer and Lemeshow goodness-of-fit χ2 was 2.53 and a p-value of 0.47, for five distinct quantile groups of the estimated probability of hospital mortality. This indicated a sound model fit. This model calibration is shown in Fig. (3). The TRACS score demonstrated little variation between the observed and expected prediction of death across its five score categories.
By multivariate analyses, the TRACS score independently predicted mortality (OR 1.14 per incremental category, 95% CI 1.01-1.28) even when adjusted for other known and well-documented, life-saving therapy covariates like revascularization, aspirin, beta blockers, heparin, and glycoprotein IIb/IIIa inhibitor use pre-cath and in the cathlab (Table 5). The Rush score risk factor sum was an important covariate of this model, and the TRACS score independently predicted mortality over and beyond that predicted by the RRF sum. Likelihood-ratio tests (LRT) between pairs of maximum likelihood logistic models were also performed to see if TRACS score had independent prognostic value. LRT was used to compare hierarchically nested models: the above full model shown in Table 5 and then a second nested model that dropped the TRACS score. This comparison resulted in a LRT χ2 value = 4.91, p = 0.0267, indicating that the TRACS score was a powerful and independent predictor of in-hospital death. Since the full model included RRF sum as one of the model covariates, the above LRT result also implies that troponin status incorporated into the TRACS score with a weight of 3, contributes significantly, over and beyond the RRF sum, in the prediction of hospital mortality. A Bayesian approach to model comparison employing the use of the Bayesian Information Criterion (BIC) difference test revealed even better results. The BIC difference uses the Bayesian Information Criterion to estimate the probability that the model would be more likely after dropping one of the explanatory variables. Using the full model in Table 5, when each explanatory variable was dropped from the full model and BIC differences between the reduced (nested) model and the full (original) models were estimated for each of the explanatory variables in the full model, only the TRACS score had the largest BIC difference of 7.3, and BIC prime of 9.4 (p= 0.026). A BIC difference of 6-10 is considered “strong evidence” for variable selection according to Raftery [16]. Thus, troponin status with a weight of 3 incorporated in the TRACS score conveyed the highest information content in the prediction of hospital mortality, when directly compared with any other factor in the model.
Finally, Kaplan Meier survival analysis demonstrated that increasing TRACS score was associated with an increasing rate of mortality as a function of hospital stay (time). Fig. (4) shows that the Kaplan Meier curves for different score categories separated early and remained separate (log rank p<0.0001). Cox proportional hazards regression yielded a hazard ratio of 1.2 (p< 0.001, 95% CI 1.1 – 1.3) per incremental score category of the TRACS score.
These analyses suggest that using troponin status in a multiplicative manner with a weight of 3 adds incremental value in risk stratification for the prediction of hospital mortality, when used to improve the Rush score.
Similar exploratory analyses using the TIMI score [8] were also performed, although this was not the primary objective of this paper. When the TIMI risk score was recalculated using troponin in a multiplicative function with a weight of 4 (as determined via logistic regression model) this modified TIMI risk score had an ROC AUC of 0.6550 that was also a significant improvement over the original TIMI risk score (ROC AUC 0.5452, p value for difference = 0.0003).
DISCUSSION
Our data suggest that troponin status bears a multiplicative relationship to in-hospital mortality in risk stratification of ACS patients. We derive and validate this relationship to be a multiplicative factor of 3. The resulting TRACS score using this relationship can better risk-stratify an unselected, ED patient population presenting with chest pain, independent of that provided by the Rush score.
Using troponin status in such a multiplicative manner creates an exponential model of risk (Fig. 1) that closely approximates risk in real-world scenarios, where truly independent risk factors acting together multiply, rather than add risk. This creates a better separation of the risk profile in the intermediate zone, and consequently improved risk prediction. A potential downfall of such a strategy is to create widely differing and unstable estimates of risk across categories of the score. The Hosmer-Lemeshow χ2 statistic, a measure of model stability and goodness-of-fit, does not demonstrate this. We hypothesize that this exponential risk modeling is a major reason for better risk prediction. In contrast, risk scores that assign a weight of 1 to troponin elevation, lose a major part of the prognostic information contained in troponin and is a reductive approach to the superior prognostic value of troponin.
Multiple large cohort and randomized studies also demonstrate that troponin is extremely important for prognostication. Recently a meta-analysis of 7 randomized trials and 11 cohort studies involving more than 10,000 patients, found that serum troponin had a three- to eightfold higher short-term risk of death for ACS patients [17]. Our data, showing a 3-fold risk is consistent with the meta-analysis data [17]. Thus, a greater emphasis on the information contained in troponin elevation for clinical decision making is a highlight of the TRACS score.
Other potential reasons account for the increased predictive ability of the TRACS score:
The TRACS score is a registry derived score, in comparison to other scores like the TIMI score that are derived and validated in clinical trial data. Non-participants in trials have a higher risk of adverse outcomes and greater heterogeneity than participants. Hence, it has been suggested that scoring systems be derived from observational data [4,18]. Our analysis from TRACS registry supports this observation. The strong discriminatory performance and superior calibration of the TRACS score indicate that it is likely to be useful in a “real-world” ACS population. Other studies done in the community reflect these observations. A community study demonstrated that AUC of the TIMI score was low for NSTEMI patients (c-statistic 0.59) [4]. Another community-based study comparing the TIMI, PURSUIT and GRACE scores identified that the TIMI score presented the lowest accuracy of the three risk scores (AUC 0.585) [2]. In this same study the GRACE score, derived from registry data, presented the best discriminatory accuracy, which was offset by its complexity that required the use of a computer program to calculate it. A Canadian registry of ACS patients [19] demonstrated that the GRACE score, derived from a less selected population compared to the PURSUIT score, provided superior calibration. These authors underscored the importance of risk model validation in the general ACS population rather than a clinical trial population to establish its generalizability before integration into clinical practice. This is consistent with our findings also. A meta-analysis of trials and cohort studies looking at the prognostic value of troponin, found that the magnitude of risk associated with a positive troponin was greater in cohort studies of consecutive patients than in clinical trials [17]. This again emphasizes that highly selected trial patients differ from unselected, heterogeneous, consecutive patients from cohort studies who have a greater potential for variation in underlying prognosis.
Study Limitations
This study suffers from several limitations. Firstly, generalizations made in calculating the sum of Rush risk factors and consequently the TRACS score (coding severe angina for example) may have resulted in an upward skew in the risk scores. This may have curtailed the discriminatory range of the risk score in the low range but is unlikely to have altered the overall pattern of risk observed in this study. Sensitivity analyses conducted with and without inclusion of the chest pain variable in the RRF and the TRACS scores, did not change the predictive performance of either of these scores. Similarly, the variable of angiographic stenosis used in the TIMI score, was modified in this analysis to include any documented history of MI or known CAD. The TIMI risk score as applied in PRISM-PLUS study also used a similar strategy and supports the expansion to include historical information that may be more widely available than angiographic data alone. As discussed in the original report of the TIMI score, it was anticipated that it might undergo some refinement during future application to facilitate wider clinical use [8].
A second major limitation of this data is that the magnitude of troponin release was not available in the TRACS dataset and no effort was made to estimate mortality risks by increasing magnitude of troponin release, while previous data have demonstrated increased mortality with higher troponin levels [20]. At worst, including troponin as only a dichotomous variable underestimates the prognostic ability of troponin (due to misclassification bias) and drives the odds ratio towards null. Despite this, we were able to demonstrate good prognostic ability of troponin in the context of the TRACS score. Generally, however, when using any risk score, it is also easier to use a single ‘yes/no’, dichotomous variable for troponin status and provides simplicity of use.
Another limitation of this study is of differences in end-points. Most risk scores use composite end-points like death and re-infarction and target vessel revascularization. In the TRACS registry information on re-infarction and urgent target vessel revascularization was not available. However, it is generally agreed that death is a robust and preferable end-point to measure [21, 22]. The main purpose of this paper is to show the incremental prognostic value of troponin in risk stratification and we were able to demonstrate that with the TRACS score, despite only a small number of patients (2.68%) experiencing a hard outcome like death. This risk stratification may be extended in other datasets to include composite end-points. The weight of 3 that was identified for predicting mortality may not be applicable when using less conservative, composite end-points.
To conclude, the ideal score for risk stratification on admission for ACS should have a good balance between complexity and utility. The TRACS score, with its greater emphasis on troponin elevation used in a multiplicative manner is simple to use and provides an advantage over risk stratification.
ABBREVIATIONS
APPENDIX
TRACS Hospital Sites
Cook County Hospital, Chicago, Illinois; Deaconess Hospital, Evansville, Indiana; East Texas Medical Center, Tyler, Texas; Lehigh Valley Hospital, Allentown, Pennsylvania; Mayo Clinic, Rochester, Minnesota; New Britain General Hospital, New Britain, Connecticut; Providence Yakima Medical Center, Yakima, Washington; Saint John Hospital, Detroit, Michigan; The Reading Hospital and Medical Center, West Reading, Pennsylvania.